Binance's Altcoin Elimination Tournament: The Survival Rules Behind 294 Delists
 Core Viewpoint

 Since 2026, Binance has delisted 42 tokens in the spot market, more than any complete year since 2022.
Author: Ethan, IOSG
TL;DR
Since 2026, Binance has delisted 42 spot tokens, surpassing any complete year since 2022; 28 perpetual contracts have been removed. An average of one batch of delist announcements every 28 days indicates that delisting is accelerating.
The spot delistings involve older tokens, while the contract delistings involve newer tokens. The median survival years of spot tokens at the time of delisting increased from 4.1 years in 2022 to 5.1 years in 2026, while contracts decreased from 1.3 years to 0.8 years.
For tokens that have been delisted from both Binance contracts and spot trading, the delisting path usually goes from Perpetuals to Spots.
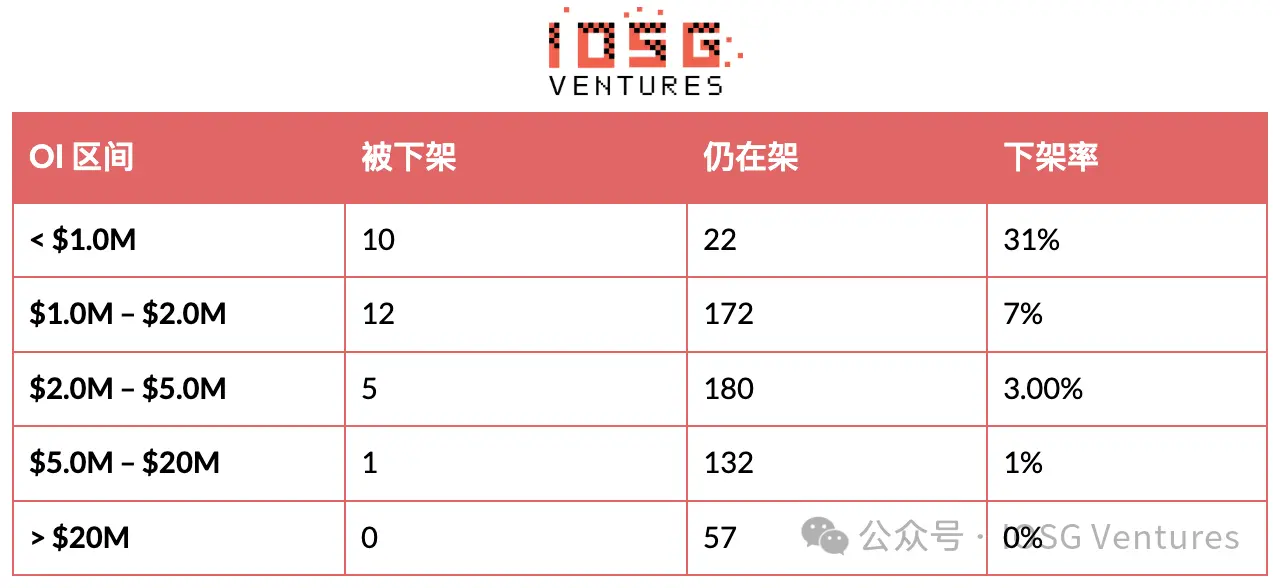
The factors determining survival are Fully Diluted Valuation (FDV) and Open Interest (OI), not trading volume. Spot tokens with an FDV below $10 million had a 49% delisting rate in 2026; none with an FDV above $100 million were delisted. Additionally, 10.6% of tokens with an average daily trading volume between $1 million and $3 million were still delisted. The delisting rate for OI below $1 million is 31%, while it is 0% for OI above $20 million.
Binance's own issuance channels provide no protection. Among the contract tokens delisted in 2026, 63% came from Binance Alpha, and out of the 42 delisted spot tokens, 11 came from Launchpool or Launchpad.
This article's data is sourced from Binance official announcements, Binance Exchange, and CoinGecko, covering a total of 144 historical spot delisting events and 150 contract delisting events from February 17, 2022, to August 11, 2026. It mainly focuses on the delisting events of Binance tokens in 2026, aiming to analyze the elimination logic behind them, the key impacts on token survival from dimensions such as token source, Fully Diluted Valuation (FDV), and trading volume, providing quantitative references for secondary market investors to identify delisting risks and for project parties to manage their listings.
I. The number of spot delistings in 2026 has reached a new high since 2022, with an accelerated delisting frequency
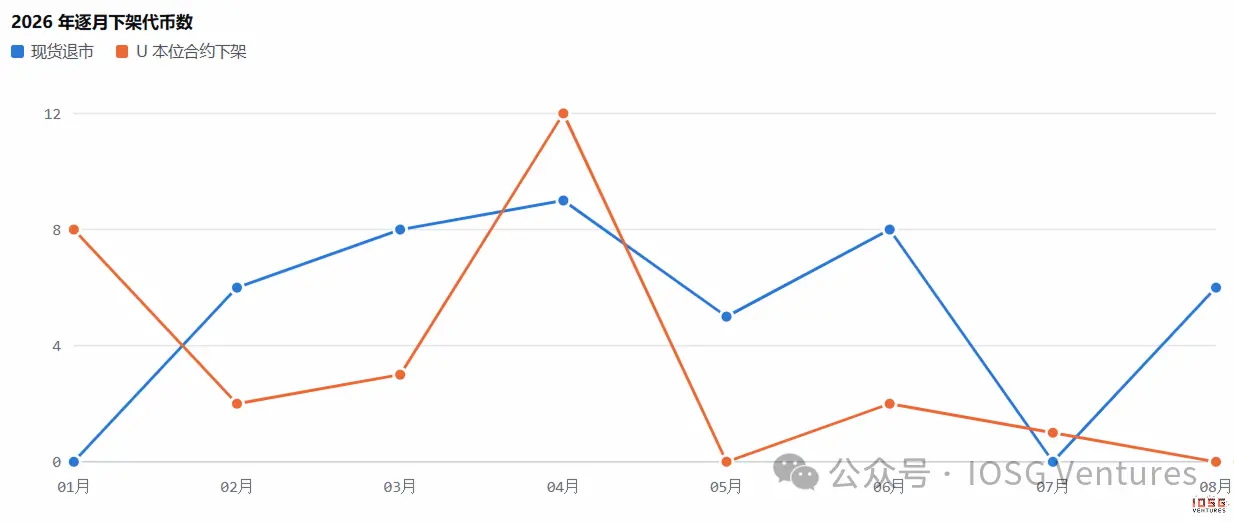
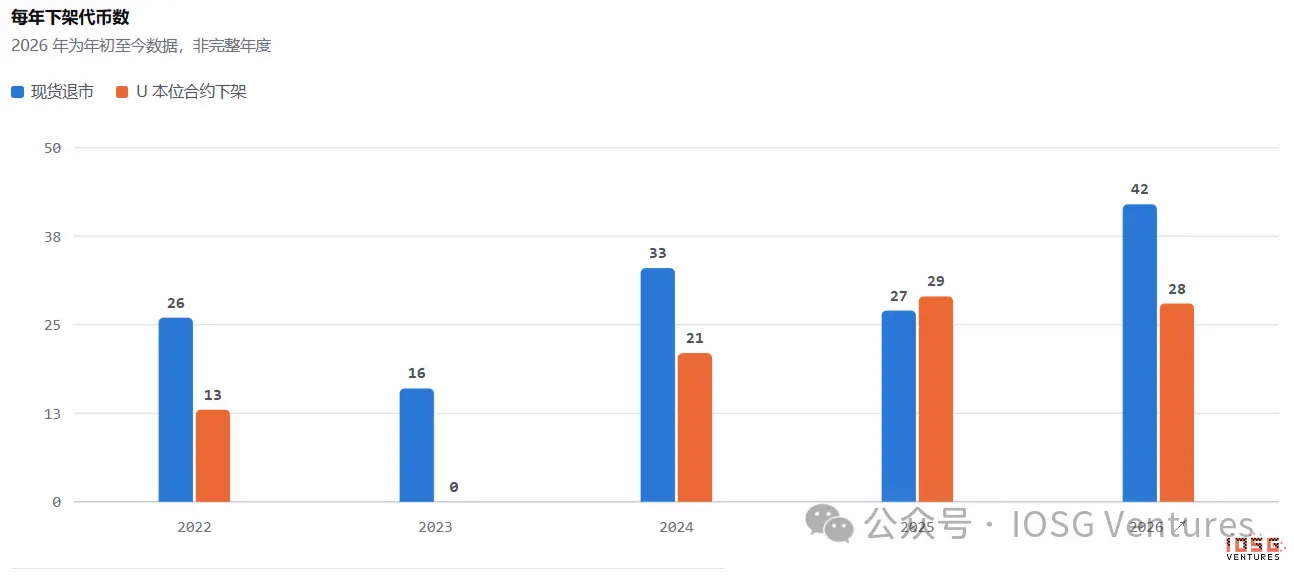 42 spot tokens and 28 contracts have been delisted in the past 8 months. The number of spot delistings has already exceeded the peak number of the previous four years, and under the impact of the U.S. stock market, this figure is expected to continue to grow significantly by the end of this year.
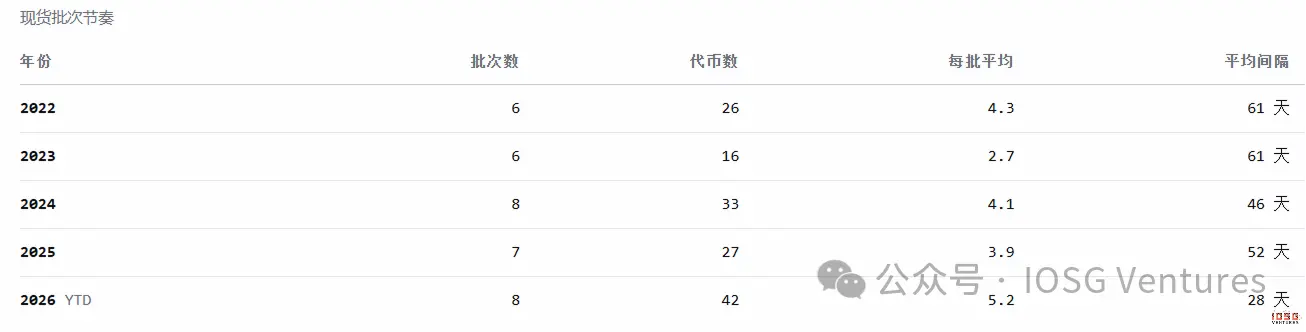
The frequency of delisting batches is accelerating: in 2026, there is an average of one batch every 28 days, compared to just 52 days in 2025. Each batch has more tokens, with an average of over 5 tokens per batch. The time intervals between the eight batches of announcements range from 8 to 44 days, with the shortest being two batches on April 9 and April 17, resulting in a total of 9 tokens delisted in a single month.
II. The older the spot tokens are cut, the newer the contract tokens are cut
The median survival years at the time of delisting are 4.1 years for spot tokens (2022) and 5.1 years (2026), while contracts are 1.3 years and 0.8 years. Among the 42 delisted spot tokens, 31 were listed in 2021 or earlier, with PIVX, FUN, and LRC surviving for 8.6 years. All 28 contract delisting events came from contracts launched after 2024, with 23 launched in 2025, and 11 did not survive for more than six months.

For the same exchange, the elimination logic of the two shelves is opposite.
Binance has historically listed 1,114 assets, of which 284 were only listed as spot, 474 were listed on both, and 356 were only listed as contracts. Among the contract tokens delisted in 2026, 93% had never been listed as spot; they never entered the spot pool that requires custody, node maintenance, and compliance commitments.
The contract layer is a low-commitment quoting layer: cash-settled, no custody required, and does not constitute endorsement, allowing for quick listing of popular narratives and rapid removal. The spot layer involves custody and endorsement; each token listed means long-term wallet, node, and compliance responsibilities. The different delisting rhythms of the two shelves are due to the different costs incurred at the time of listing.
Thus, when looking at these two lines together, spot delistings are clearing historical inventory, while contract delistings are retracting speculative exposure.
III. Delisting Path: From Perps to Spot
Statistics on projects delisted from one of the two shelves:
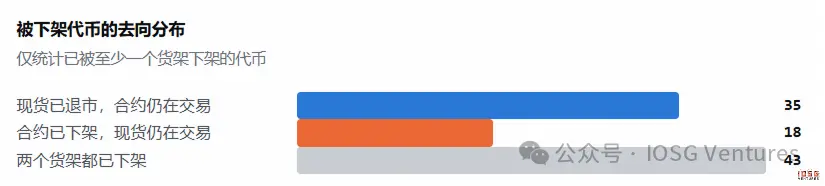
There are 35 tokens that have been delisted from spot but are still trading as contracts, while the reverse situation has only 18, and 43 tokens have been delisted from both shelves.
Cutting spot tokens saves real operational costs while reducing regulatory and reputational exposure; cutting contracts does not save money and requires giving up potential returns, including volatility, funding rates, and liquidation. An asset that has completed its fundamentals can still make money as a purely financial derivative.
IV. Which projects are disappearing
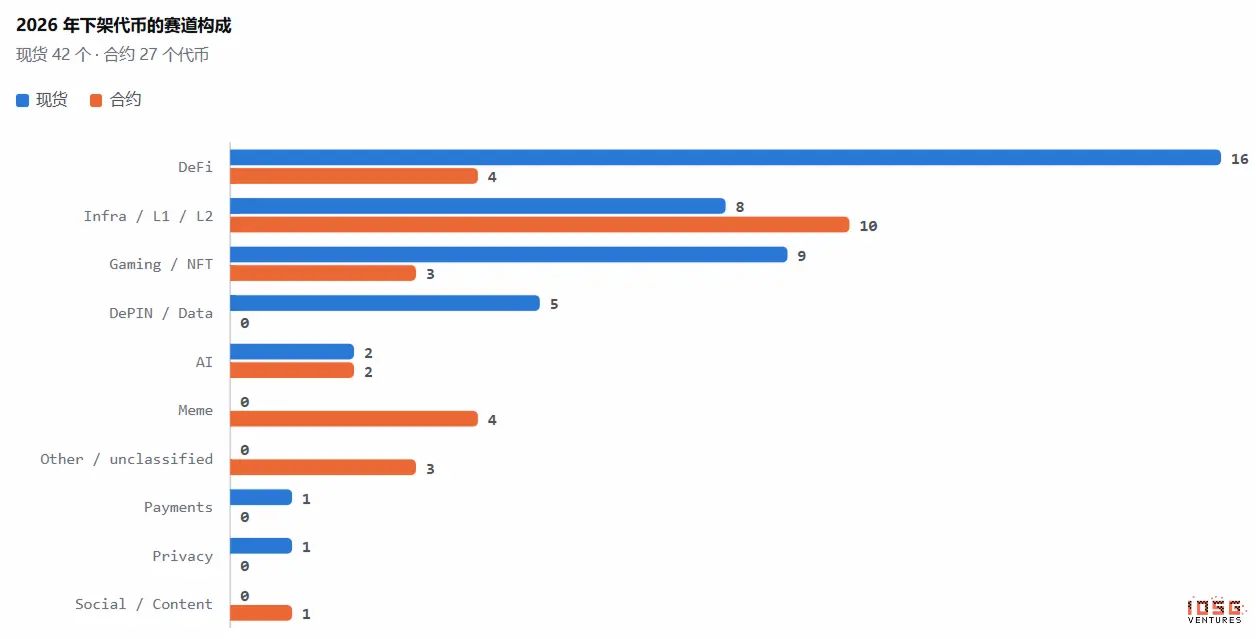 The composition of spot delistings in 2026 includes: 16 from DeFi (38%), 9 from Gaming/NFT (21%), 8 from Infra/L1/L2, and 5 from DePIN/Data. The first two categories account for nearly 60%, and the vast majority are assets listed between 2020 and 2021, with 20 out of 42 concentrated in these two years.
The composition on the contract side is completely different: 10 from Infra/L1/L2, 4 from DeFi, and 4 from Meme, mainly cleaning up narratives from the past two years.
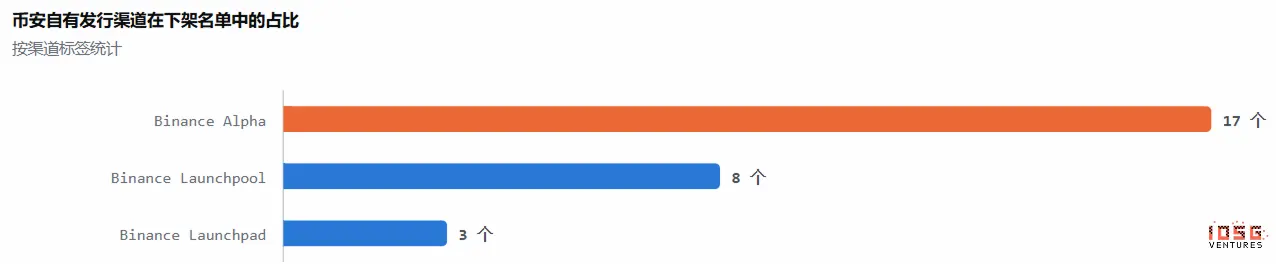
Binance's own issuance channels account for a significant portion of the list. Among the contract tokens delisted in 2026, 63% came from Binance Alpha Spotlight, including ZKJ, PUFFER, TANSSI, and YALA; 11 out of the 42 spot tokens (26%) came from Launchpool or Launchpad, including NTRN, RDNT, HIGH, MBOX, and HFT. The most extreme case is A2Z, a Launchpad project that was listed as spot in July 2025 and delisted in April 2026, surviving for only 8 months.
Going through Alpha or Launchpool provides a one-time distribution and a period of exposure, not a long-term position.
V. What determines survival are FDV and OI, not trading volume
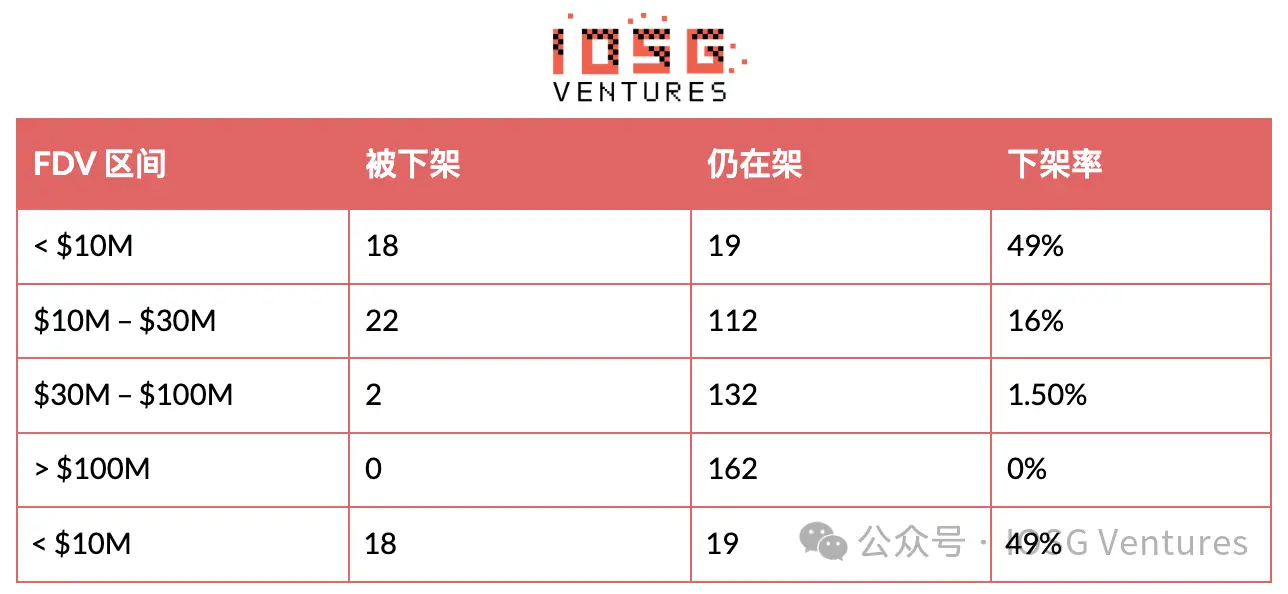
For Binance spot, comparing the delisted tokens in 2026 with those still listed in the same range, the delisting rates for each range are calculated based on FDV and trading volume indicators. Delisting rates for spot tokens by FDV
Delisting rates for spot tokens by average daily trading volume
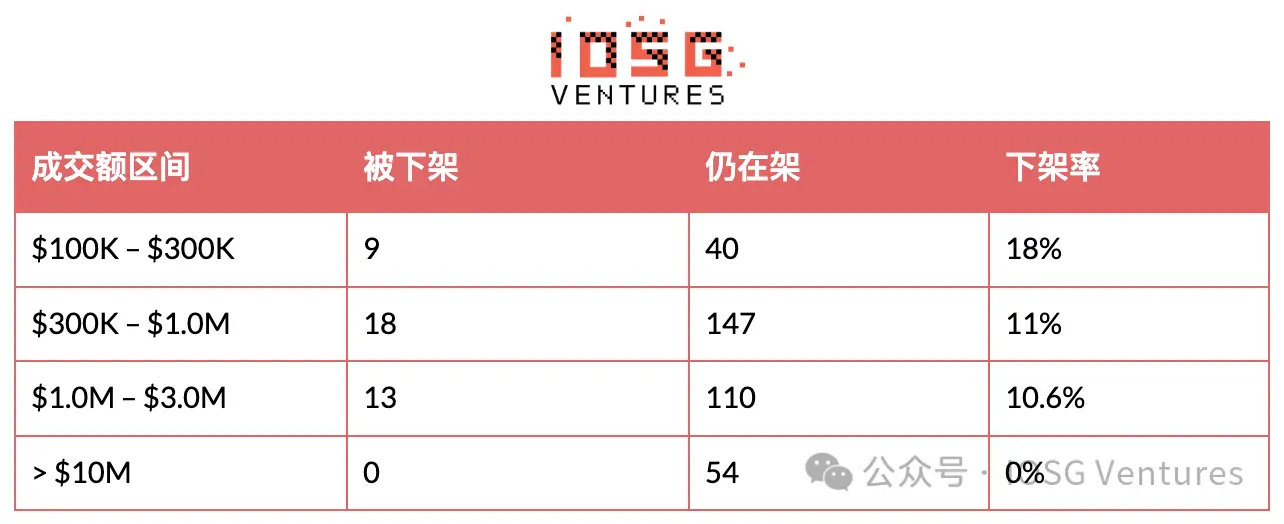 The differentiation of FDV among delisted projects is very clear. For an FDV threshold of $10 million, the delisting rate drops from 49% to 16%, crossing two orders of magnitude; the trading volume between $100k and $3 million is almost a flat line, with delisting rates between 10% and 18%. The quartiles show the same trend: the median FDV of the delisted group is $10.53 million, while that of the listed group is $56.88 million, a difference of 5.4 times; the median trading volume is $650,000 versus $1.19 million, only a difference of 1.8 times.
On the contract side, we mainly focus on the Open Interest (OI) indicator. Delisting rates for U-based contracts by Open Interest (OI)
Delisting rates for U-based contracts by average daily trading volume
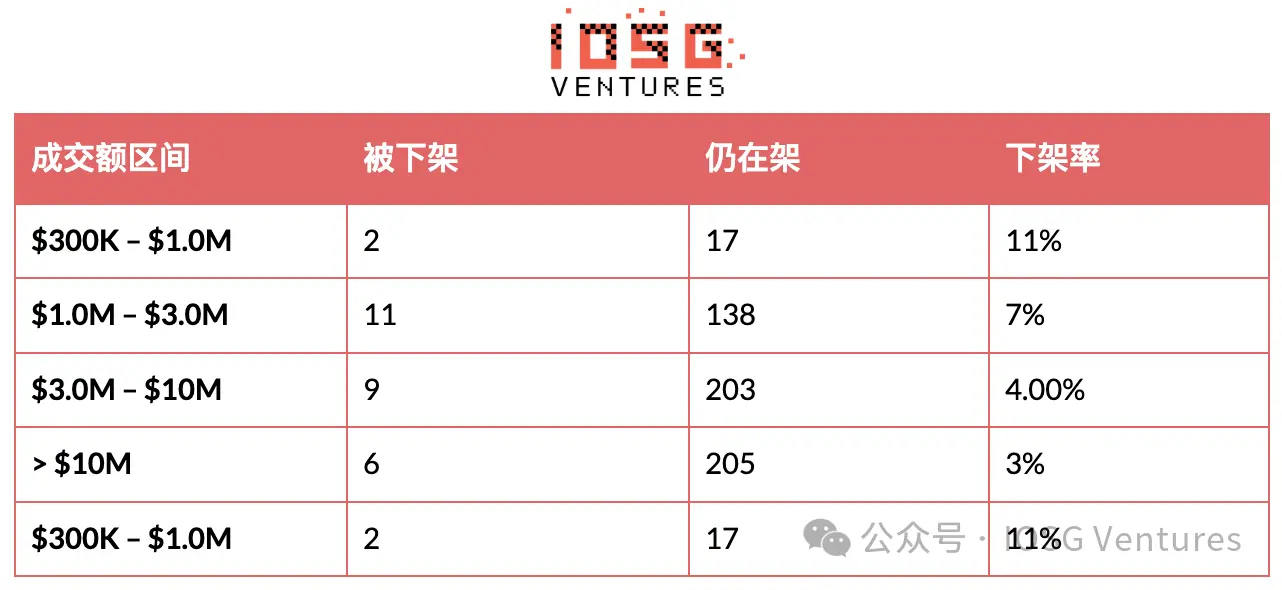
The delisting rate for OI below $1 million is 31%, while it is 0% for OI above $20 million; the median OI for the delisted group is 1.21 million, while for the non-delisted group it is 3.13 million. Additionally, 2.8% of contracts with trading volumes above $100 million were still delisted, with COMMON having an average daily trading volume of $29.35 million before the announcement and RVV at $2.854 million, yet still being removed from Binance contracts.
Trading volume can easily be manipulated by wash trading, high-frequency quant trading, or frequent short-term turnover, and even if it shows millions of dollars in trading volume daily, it may just be low-cost "wash noise" within a very small capital pool, failing to reflect the true health of the asset. In contrast, FDV represents the overall capital accumulation and resistance to selling pressure of the project, determining the support for spot; OI represents the real margin and speculative funds accumulated on the market, determining the depth and risk control safety of contracts. Therefore, FDV and OI are the hardest indicators reflecting the long-term survival value and risk baseline of assets.
VI. Inspiration
# For project parties: Focus on capital and fund accumulation, abandon false volume manipulation
Abandon false volume manipulation: Trading volume cannot mask liquidity exhaustion. The trading volume generated by market makers and quant trading cannot serve as a protective umbrella; risk control only looks at capital retention.
Defend the FDV/OI Line: The spot must maintain the project's market value and capital accumulation (FDV remains above $10M); contracts must introduce real hedging and speculative funds (OI remains above $1.0M).
Channel Exposure Does Not Equal a Talisman: Binance Alpha or Launchpool/pad only provide initial exposure; if there is no real ecosystem and capital pool after going live, it will also be quickly delisted.
# To Investors: Beware of False Liquidity, Track Rigid Risk Control Indicators
Avoid High Trading Volume Traps: Be cautious of assets with high trading volume but low FDV or low OI; such assets are often a facade created by wash trading and face the risk of liquidation and delisting at any time.
Set Delisting Warning Red Lines: Set the spot FDV < $10M and contract OI < $1.0M as high-risk delisting red lines; promptly liquidate or reduce leverage to avoid liquidity discounts and liquidation losses.
Differentiate Shelf Elimination Logic: For established DeFi/Gaming projects, shrinking FDV must guard against spot delisting; for new narrative projects in the past two years, if contract OI is lacking, one must guard against the chain reaction of sell-offs caused by derivatives delisting.
 Risk warning