GSR: Why is it difficult for low circulation, high FDV tokens to escape decline?
 Core Viewpoint

 The median return of tokens with a market capitalization exceeding 1 billion USD one year after listing is negative 81%.
Author: Josh Riezman, Chief Legal and Strategy Officer at GSR; Slater Santer, Research Analyst at GSR
Compiled by: Jiahua, ChainCatcher
Key Points
The GSR research team collaborated with the consulting team to systematically review the token listing records of major exchanges since 2013, covering over 2,300 token issuances and documenting the performance of each issuance, initial circulation ratio, fully diluted valuation (FDV), and the sector to which they belong.
Since the era of public token offerings, the initial circulation ratio at the time of listing has halved. The median initial circulation ratio at listing dropped from 38% in 2017 to 13% in 2020, with only partial recovery since then.
The higher the issuance valuation, the lower the median initial circulation ratio at listing: tokens with a listing FDV below $10 million had a median initial circulation ratio of 97%; for tokens with a listing FDV above $1 billion, this ratio was 14%.
Tokens with a listing FDV exceeding $1 billion performed the worst, with a median return of -81% one year later. Tokens with an initial circulation ratio below 20% saw a decline of about 75% after one year; those with an initial circulation ratio between 30% and 50% experienced a decline of about 45%.
This is no longer an issue unique to the cryptocurrency industry. The stock market is also gradually moving towards a similar pattern: companies remain private for longer, insiders continuously accumulate holdings before the public can buy in, and since 2019, IPOs have consistently underperformed the market over a three-year holding period.
GSR actively participates in token issuance and secondary market operations, including providing market-making and liquidity support for foundations, project teams, and early investors, as well as issuance and listing consulting, over-the-counter trading execution, and block trading services.
The performance of tokens with low initial circulation ratios and high FDVs has been repeatedly observed in hundreds of cases. A token may list at a high fully diluted valuation (FDV) but with only a small supply entering circulation. Prices may briefly rise, but across the overall sample, they eventually decline gradually.
However, we hope to further understand the mechanisms behind this process, both to serve our clients and to better understand the market we are in: Does the initial circulation ratio determine the average return after a token is listed? Is there a correlation with FDV? How should this issuance model be improved?
In collaboration with the GSR research team and consulting team, we compiled all token listing records from major exchanges since 2013, creating the industry's first dataset of this kind, covering over 2,300 token issuances.
The research results are not optimistic. Since we tracked all token issuances, the data also includes tokens that have lost active trading or been delisted, so these numbers are not overestimated due to survivor bias. On a median basis, tokens fall below their issuance price within three days of listing, with a 50% decline within 90 days.
Clearly, recent token issuances have disappointed buyers. Why is this issuance structure almost destined to produce such results? What should better token issuances look like?
Initial Circulation Ratio Halved at Listing, Valuation Did Not Decline Simultaneously
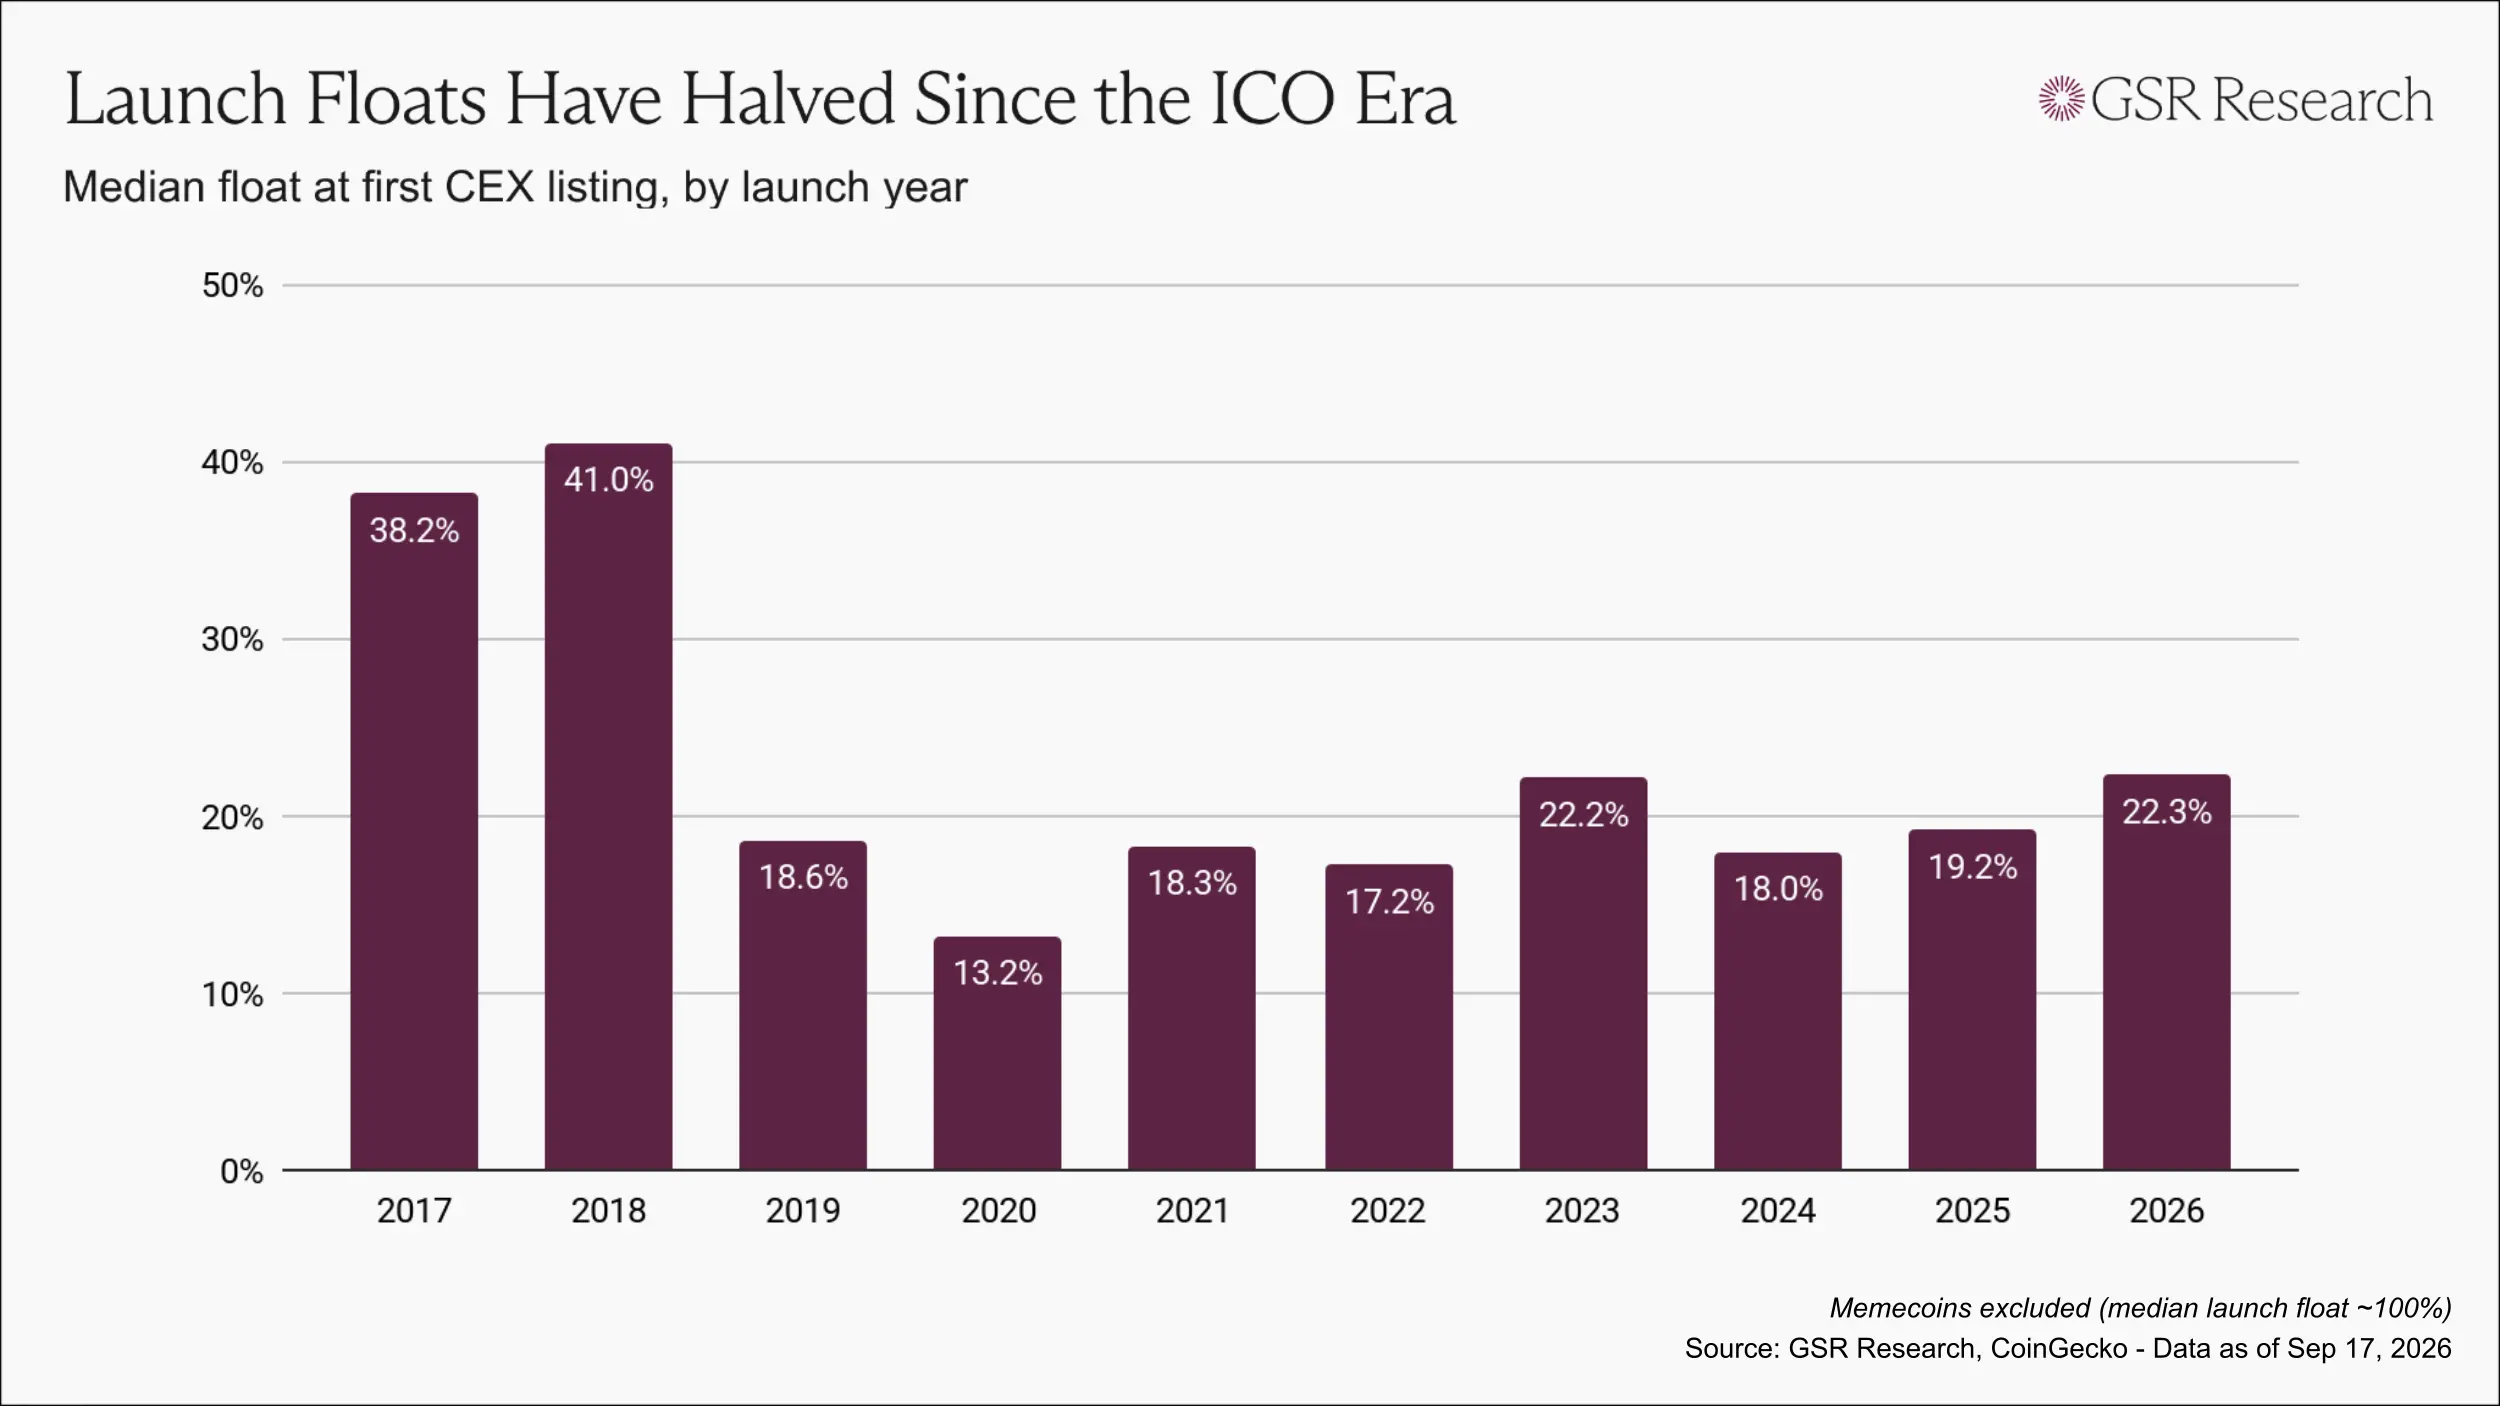
The early token issuance era had many issues, but at least it allowed tokens to enter the public's hands sooner. In 2017 and 2018, the median initial circulation ratio at the first listing was between 38% and 41%.
As regulatory enforcement tightened, financing gradually shifted to private placements, and the token issuance model reversed: valuations were set by venture capital rounds, with points and airdrop plans replacing public sales. By 2020, the median initial circulation ratio at listing had dropped to about 13%.
Since then, the initial circulation ratio has seen some recovery, but most years remain at levels just above a few percentage points to just over 20%.
However, observing the initial circulation ratio alone underestimates the problem, as the circulation ratio must be assessed in conjunction with valuation. The impact of a token with an FDV below $50 million releasing 5% of its supply is entirely different from that of a token with an FDV reaching $1 billion releasing 5% of its supply.
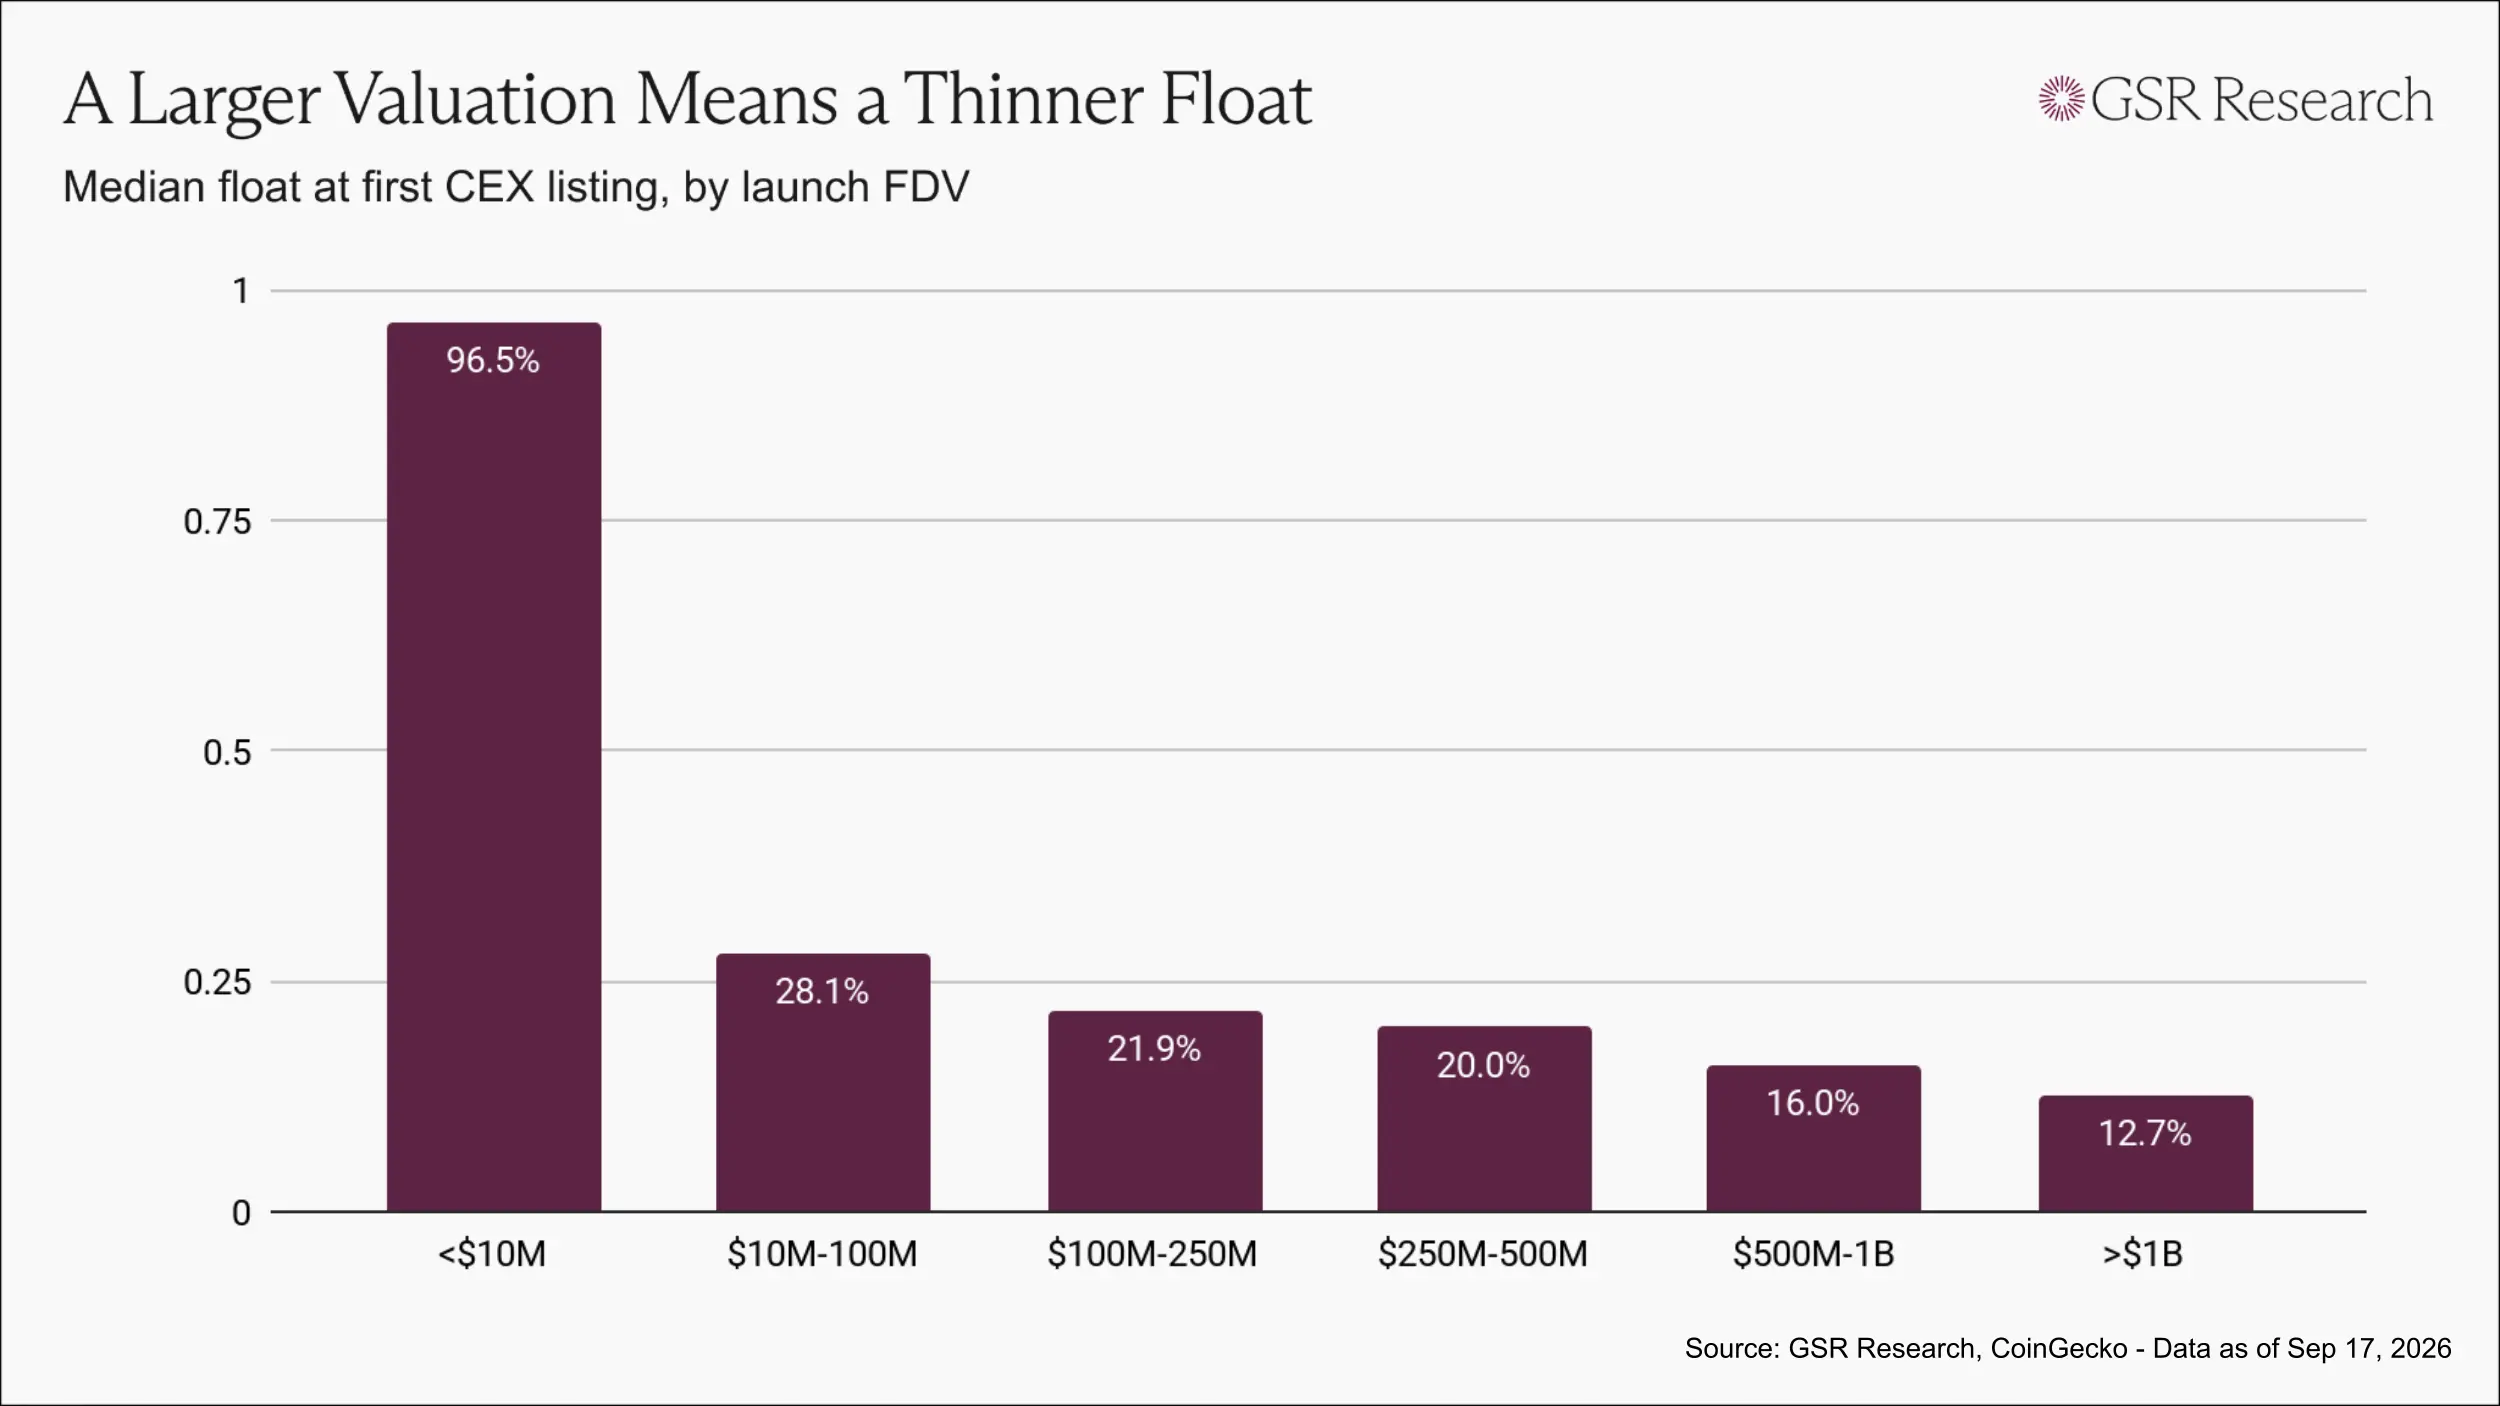
The higher the listing FDV, the lower the median initial circulation ratio at listing: tokens with a listing FDV below $10 million had a median initial circulation ratio of 97%; those between $10 million and $100 million had a ratio of 28%; those between $500 million and $1 billion had a ratio of 16%; and tokens over $1 billion had a ratio of 13%.
Clearly, this is not a coincidence but rather a gradually formed issuance pattern in the industry: the higher the valuation, the thinner the circulation.
Why These Tokens Continue to Decline
When only a small amount of supply enters trading, even with limited demand, it can still push up the overall valuation of the token.
All parties involved in the issuance can benefit on the first day. Venture capitalists' holdings are revalued at the listing price, and the tokens held by the team are also calculated at the same price, while trading platforms can list a prominently high-valued asset. The only ones who benefit from a lower token price are the buyers.
Subsequently, the unlocking schedule begins to take effect. Tokens that were not part of the initial circulation will gradually enter the market according to the publicly disclosed schedule and will be sold at prices discovered by the limited initial circulation.
This outcome does not require any malice from anyone. The issuance structure itself is sufficient to incentivize all parties to ultimately produce the same result.
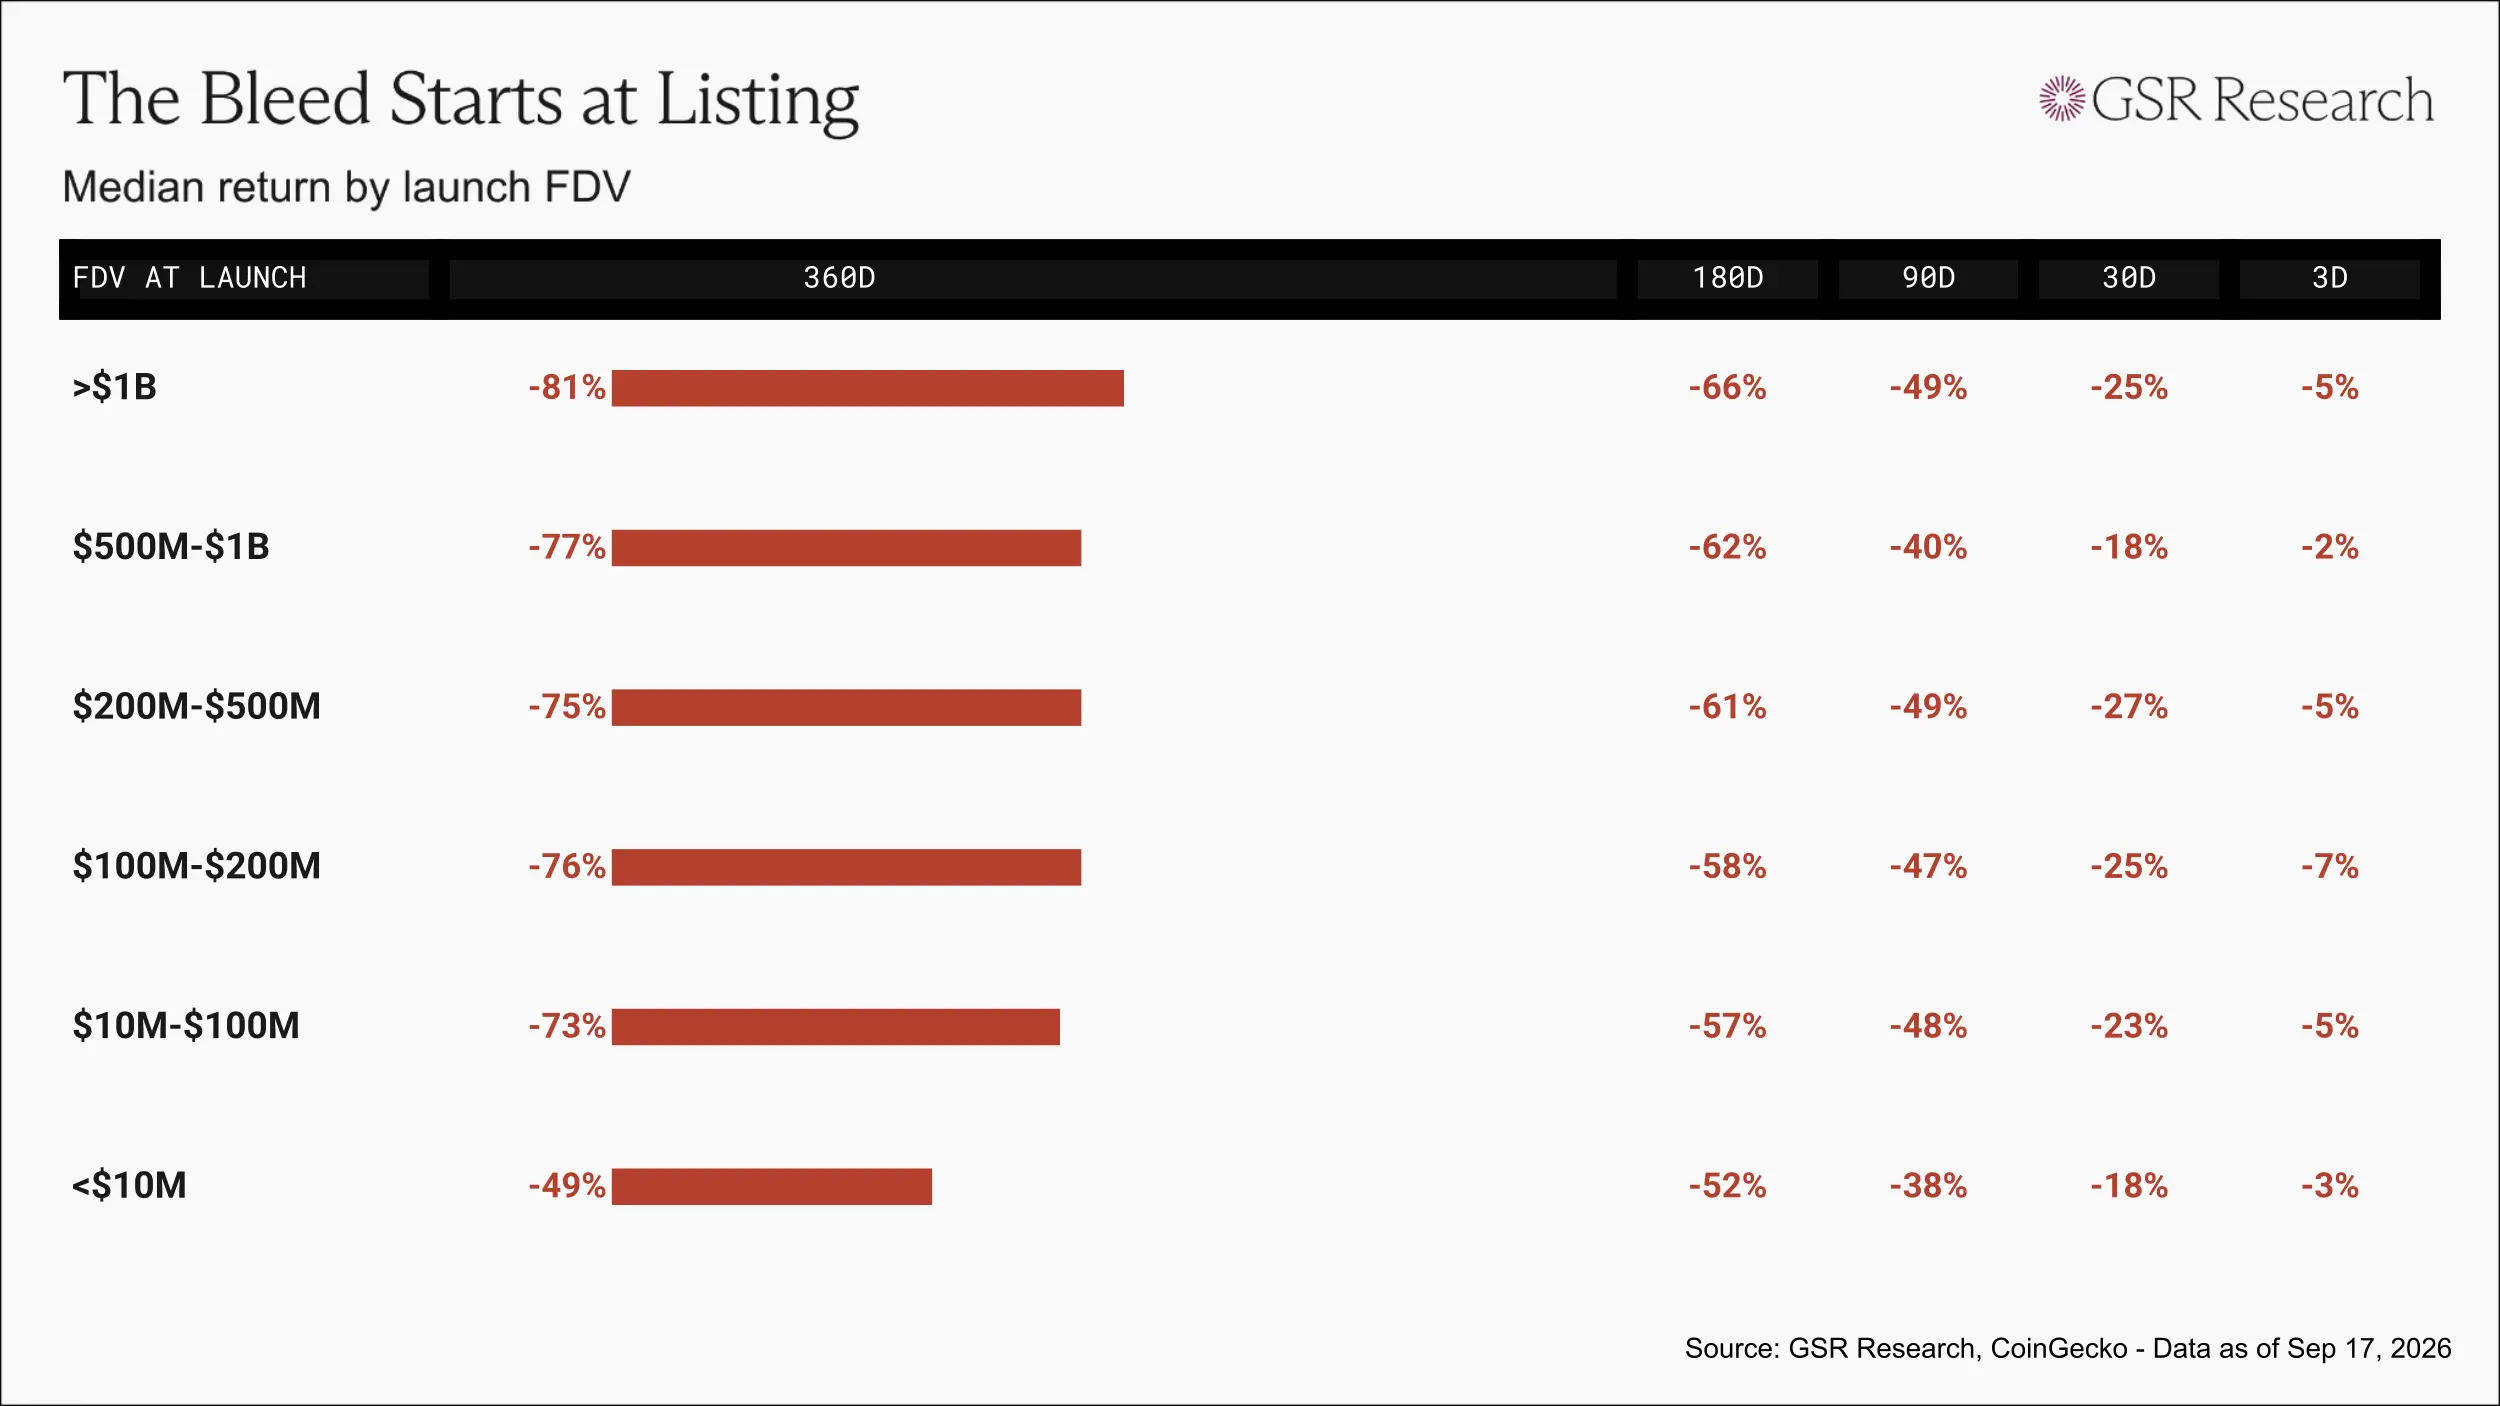
From a median performance perspective, tokens fall below their issuance price within three days of listing, with a decline of about 20% to 25% after one month, and a decline approaching 50% after 90 days.
Among projects with a listing FDV exceeding $1 billion, every $1 invested has a median value of only $0.19 after 360 days.
The Stock Market is Also Following the Same Path
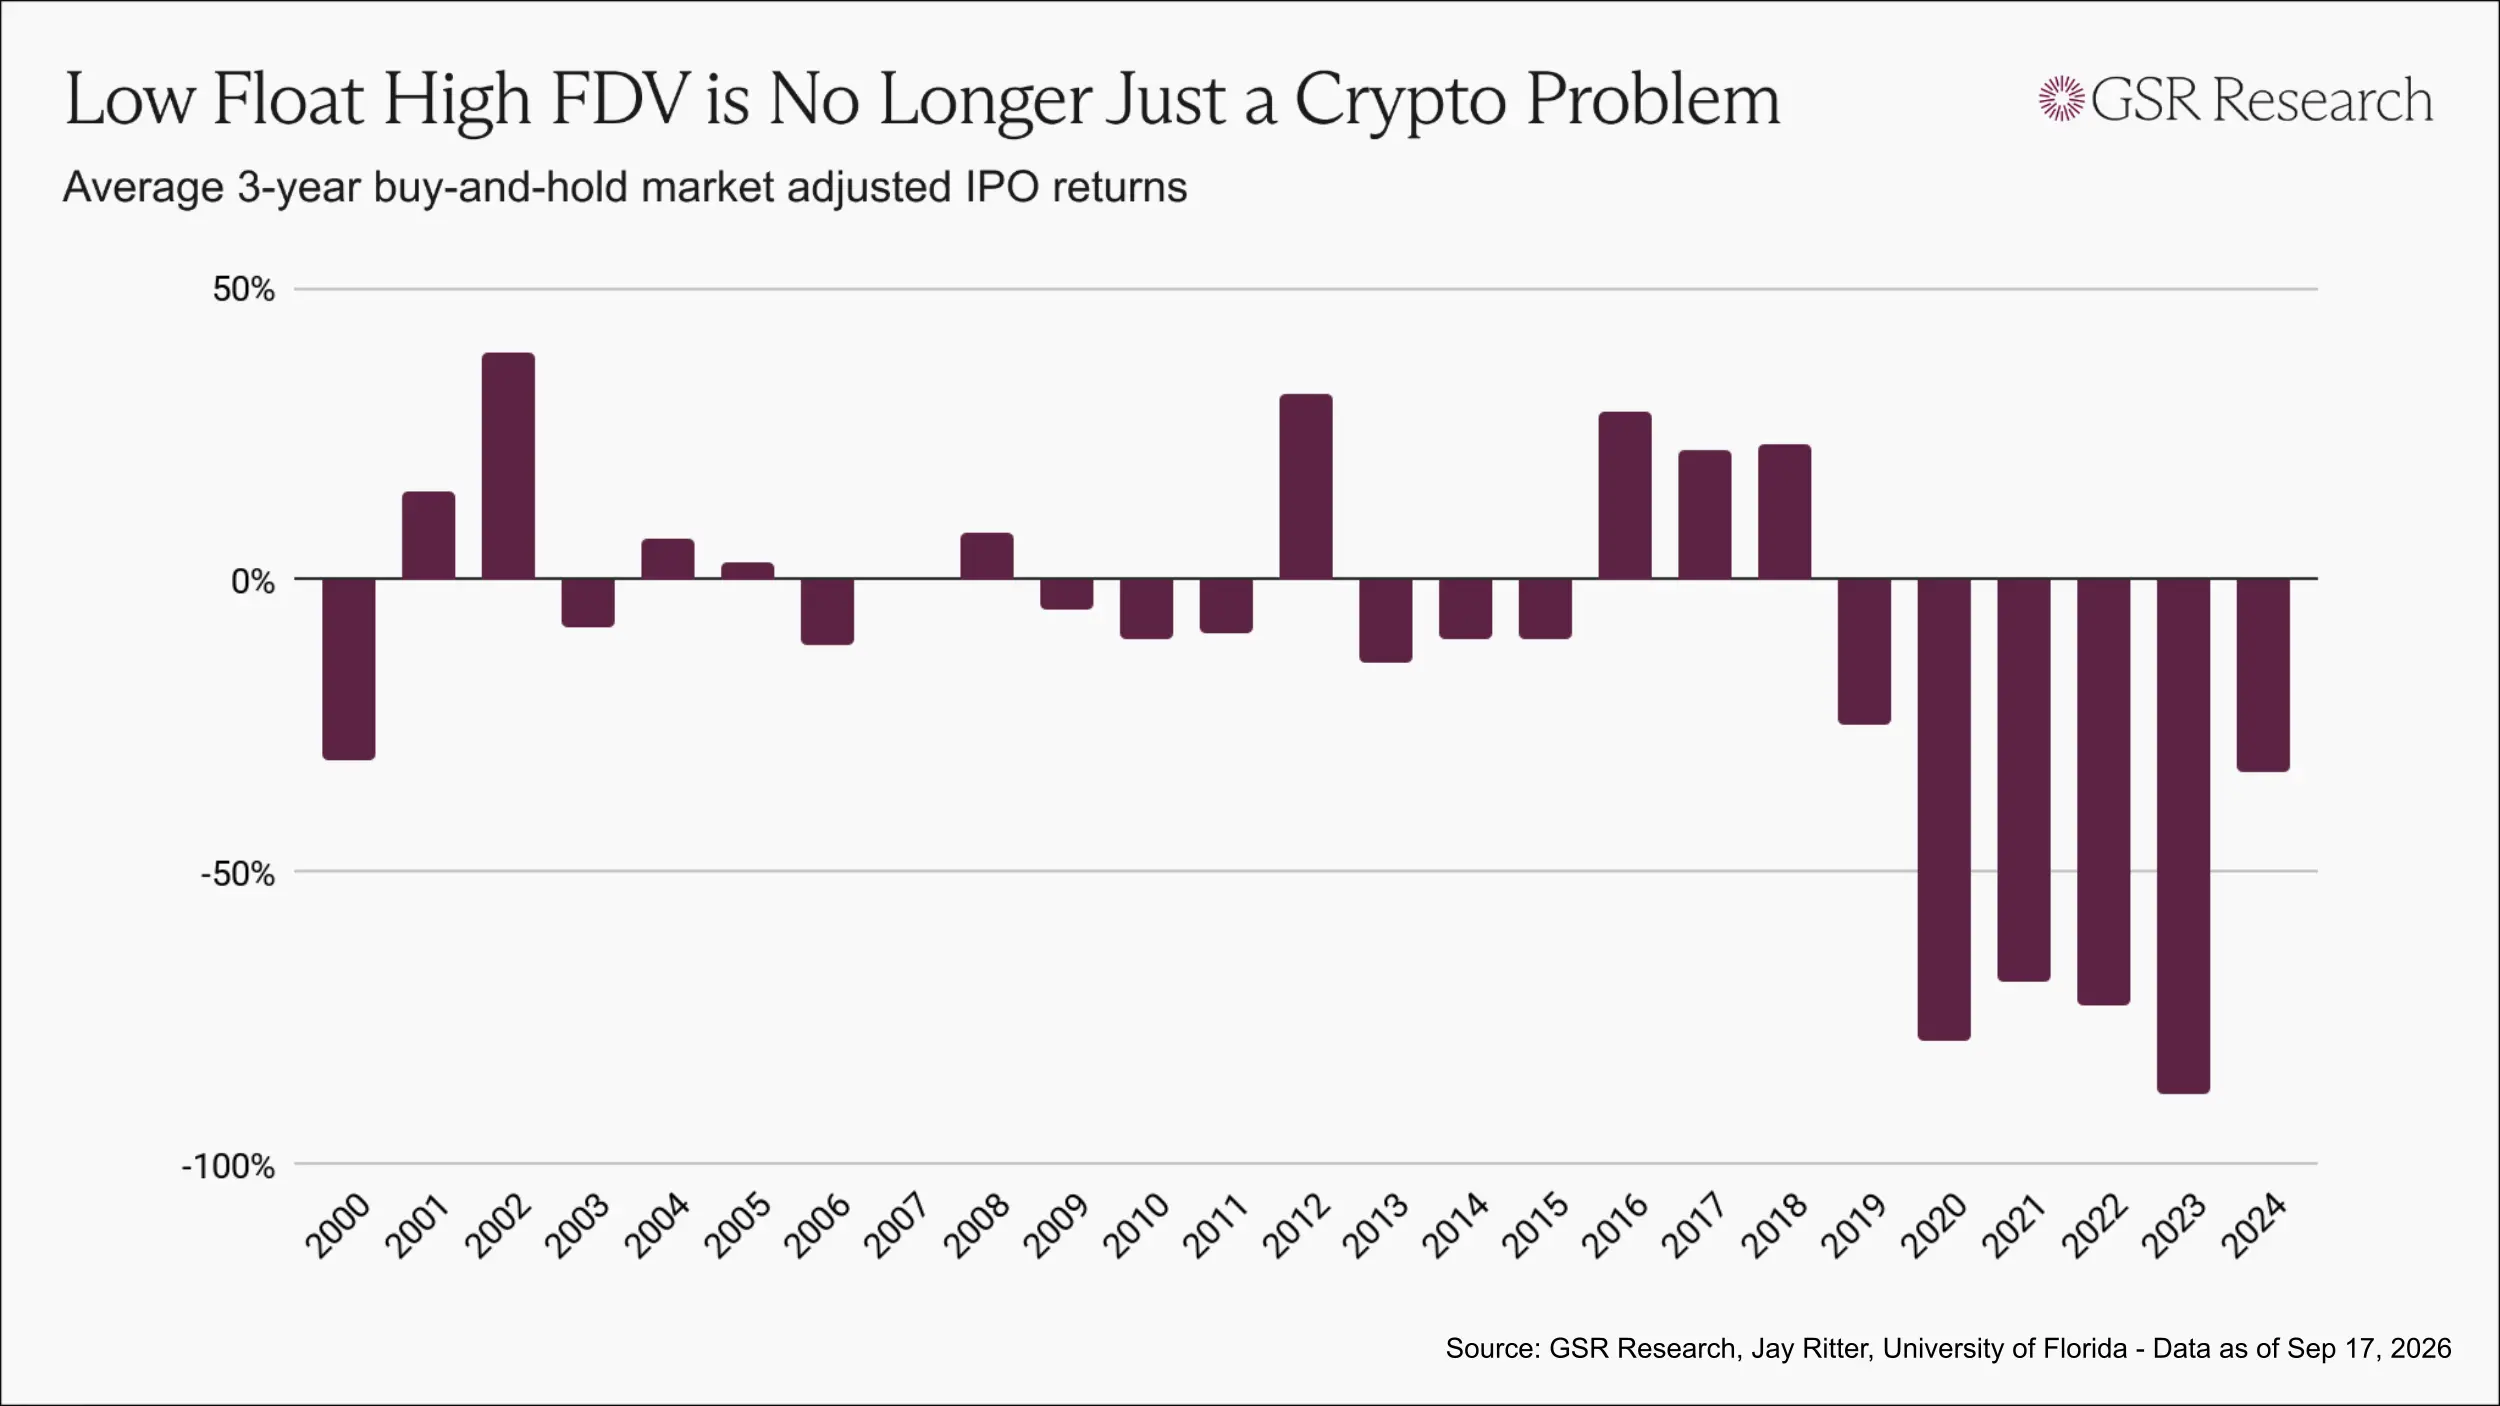
The low initial circulation ratio and high FDV model is often considered a problem unique to the cryptocurrency industry. However, in recent years, the stock market has also gradually moved towards a similar structure.
Companies like SpaceX have remained private for up to ten years, with insiders and later-stage funds continuously accumulating holdings as valuations rise, ultimately releasing only a small portion of shares to the public at the time of listing.
Based on the performance of buying and holding for three years, IPO samples from each year since 2019 have consistently underperformed the market, with the most recent batches at historically low levels.
The token issuance issues in the cryptocurrency industry are actually common problems faced by modern new issuance markets, with the only difference being that token unlocks happen faster and there is less information disclosure.
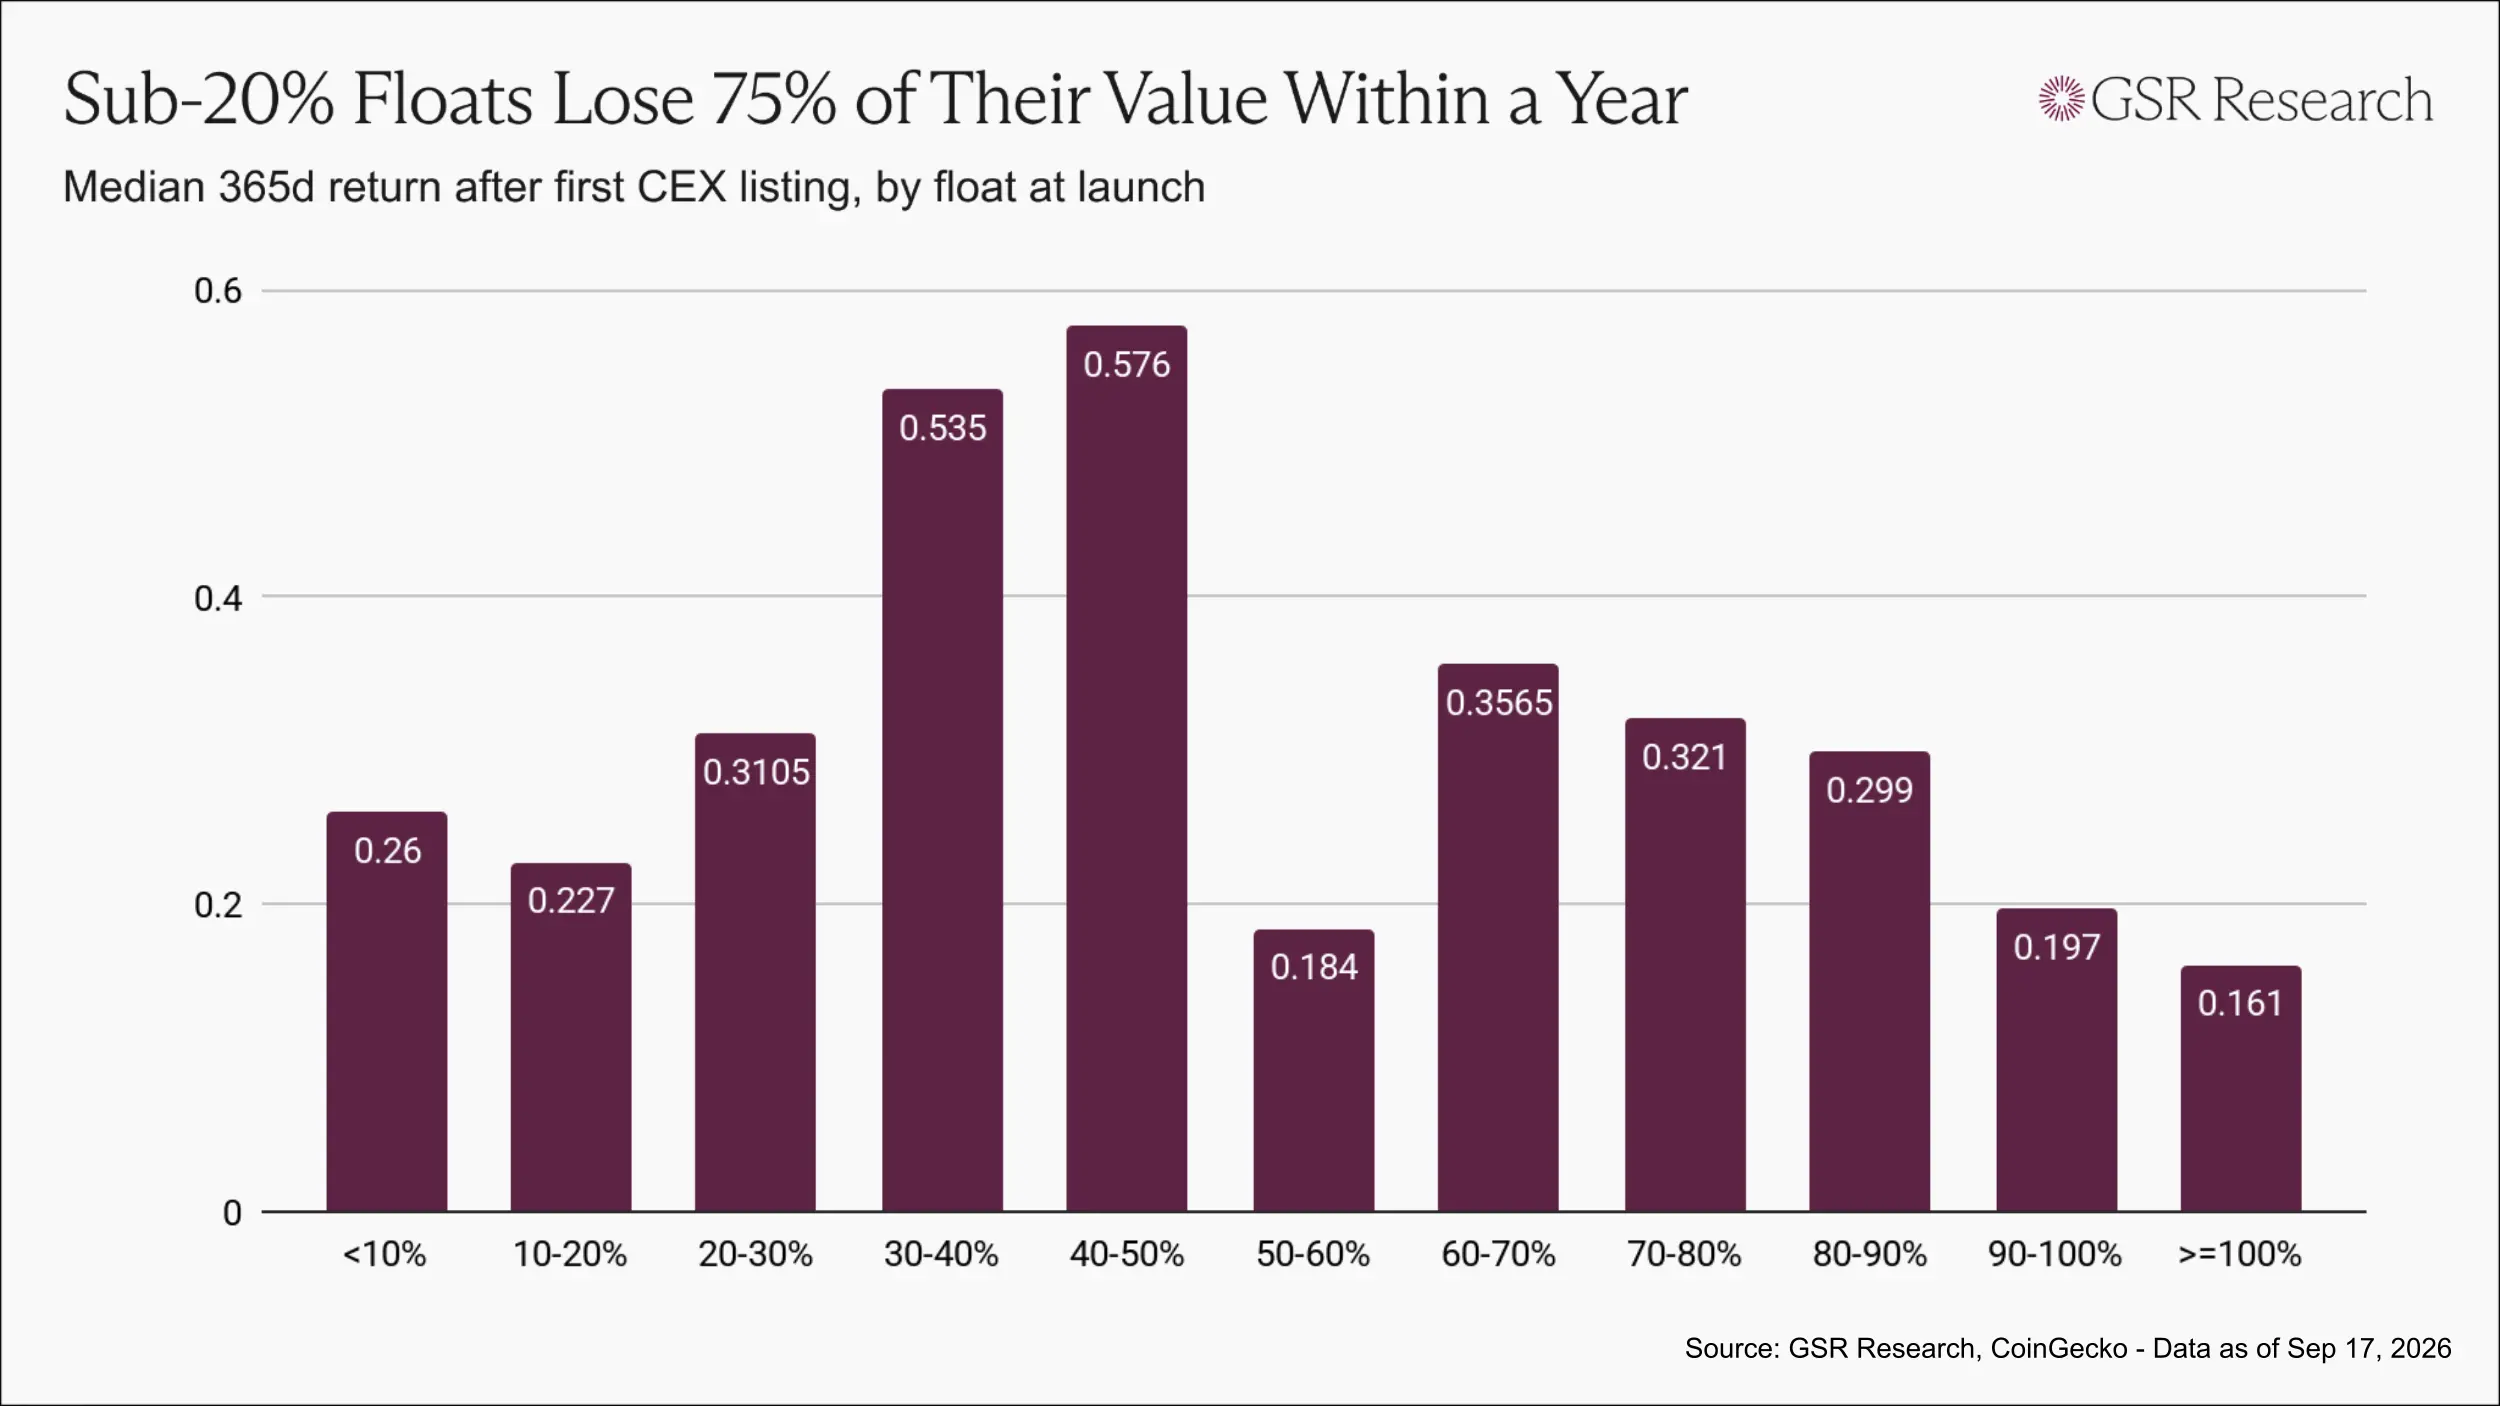
In the cryptocurrency market, tokens with an initial circulation ratio below 20% have a median value of about $0.23 to $0.26 for every $1 invested after one year.
Tokens with an initial circulation ratio between 30% and 50% have a median value of about $0.55 for every $1 invested after one year, more than double that of the former.
However, in the range where the initial circulation ratio is close to 100%, this relationship no longer holds, as these tokens are primarily low-market-cap tokens and meme coins.
Nevertheless, within the issuance range of projects that are more favored by the market, projects with higher initial circulation ratios and broader token distribution perform better than those that deliberately create scarcity through low circulation.
What is a Better Issuance Method
There is no single solution that can address all issues, and we do not believe anyone can truly provide a one-size-fits-all answer. However, based on hundreds of token issuances, several key areas for adjustment can be identified.
First, issuance pricing should allow both holders and traders to benefit.
Communities that can withstand the test of time in this industry often form around a few assets that the public can buy early at a lower price. Simply put, as long as holders benefit, it is easier for a community to form.
If a project sets the initial public token allocation at the highest private placement valuation, the result will be entirely the opposite: it attracts holders who are likely to buy at a disappointing price from the start, which will also drive traders away.
A token that continuously declines from day one cannot form sustained two-way trading and lacks sufficient reasons to attract short-term traders. When holders want to sell, there will not be enough buying interest in the market.
These two types of participants complement each other. Traders provide the liquidity and price volatility that holders need, while holders provide a stable demand base that makes the market worth trading.
If the issuance price only benefits insiders, both types of participants will ultimately be lost. Projects should sell tokens to the community earlier and at a lower price, rather than waiting until the valuation peaks to allow the public to first access the asset.
Second, sufficient supply should be released to allow the market to achieve genuine price discovery.
This ratio should be significantly higher than the low levels of 13% to 20% seen between 2020 and 2022, and it must be assessed in conjunction with valuation, not in isolation from the initial circulation ratio.
As a reference, stock IPOs typically offer about 30% of shares to the public, with 50% already considered a high level. For large assets in the cryptocurrency market, it is usually not appropriate to release more than half of the supply at listing.
The goal is to ensure that the circulation on the first day is large enough for the first-day price to be genuinely meaningful.
Finally, the range of participants should be expanded, allowing more people to participate earlier.
Opportunities for participation are as important as the initial circulation ratio. In recent years, co-investment platforms have developed and gained popularity, enabling small investors to participate in projects under venture capital terms. Additionally, there are models such as token quotas based on reputation screening for real users, public sale platforms, on-chain auctions, and fully liquid fair issuance.
These models each have their trade-offs but are all promoting broader participation.
Moreover, the legal and compliance environment has also significantly improved.
In Europe, the Markets in Crypto-Assets Regulation (MiCA) has allowed issuers to sell tokens directly to the public. In the United States, the current version of the CLARITY Act draft considers allowing direct sales to retail investors with limits.
If the bill is passed, the persuasive power of the statement "the Securities Law forces projects to adopt a private placement accumulation model" will significantly weaken. At that time, the token issuance structure will also shift from a passive result under regulatory constraints to a solution that the project parties can actively choose.
 Risk warning


Popular articles