2026 Crypto TradFi Landscape Report: How Competition Evolves Under Explosive Growth? | RootData Research
 Core Viewpoint

 In the first half of the year, the trading volume exceeded 1.3 trillion USD, with derivatives accounting for 98.6%.
Author: RootData
Introduction
In 2026, TradFi assets are becoming a new battleground for cryptocurrency exchanges.
As precious metals like gold and silver, as well as global stock markets such as the US and Korean stock markets, become increasingly active, more and more cryptocurrency exchanges are pushing TradFi products from the periphery to the core product line. Assets that could only be traded in traditional brokerages and financial markets are now entering cryptocurrency trading platforms through tokenized assets, perpetual contracts, and other forms.
Cryptocurrency exchanges are also opening up new growth spaces, breaking the long-standing cyclical shackles of the crypto market, which has made TradFi a new competitive variable for major exchanges.
Against this backdrop, RootData will observe the development status of TradFi in the crypto market from multiple dimensions, including market size, trading structure, exchange competition, and the core sub-market of stock derivatives (contracts), as well as the evolution of the landscape among major exchanges.
This report is based on statistical data from the TradFi sectors of several leading exchanges, including Binance, Hyperliquid, OKX, Gate, and Bybit, focusing on tokenized asset-related contracts and spot trading, excluding real stock trading from traditional brokers. Given that the current liquidity and users of TradFi trading are still highly concentrated on the leading cryptocurrency trading platforms that have launched this category, selecting these core platforms for horizontal comparison can better reflect the current scale, structure, and competitive landscape of the crypto TradFi market.
I. Overview of the Crypto TradFi Track
1. Cumulative trading exceeds $1.3 trillion in H1 2026, entering an explosive growth phase
In the first half of 2026, the crypto TradFi track has moved from "marginal testing" to the "explosive growth" phase. The sample data from leading mainstream exchanges in the first half of 2026 has surpassed $1.3 trillion, while the total trading volume for the TradFi track in 2025 was only in the hundreds of billions. The trading volume in just the first half of 2026 is already ten times that of the entire previous year.
The background of this growth is the resonance formed between the early layout of cryptocurrency exchanges in TradFi and the trends in traditional financial markets.
Since 2025, mainstream platforms represented by Binance, OKX, and Gate have continuously increased their TradFi product lines, completing the early layout of infrastructure. With strong performances in global stock markets such as precious metals and US and Korean stocks this year, exchanges that have preemptively laid out crypto TradFi have actively launched popular TradFi asset targets and continuously iterated on functionality, capturing a massive spillover demand and the dividends of the traditional financial market.
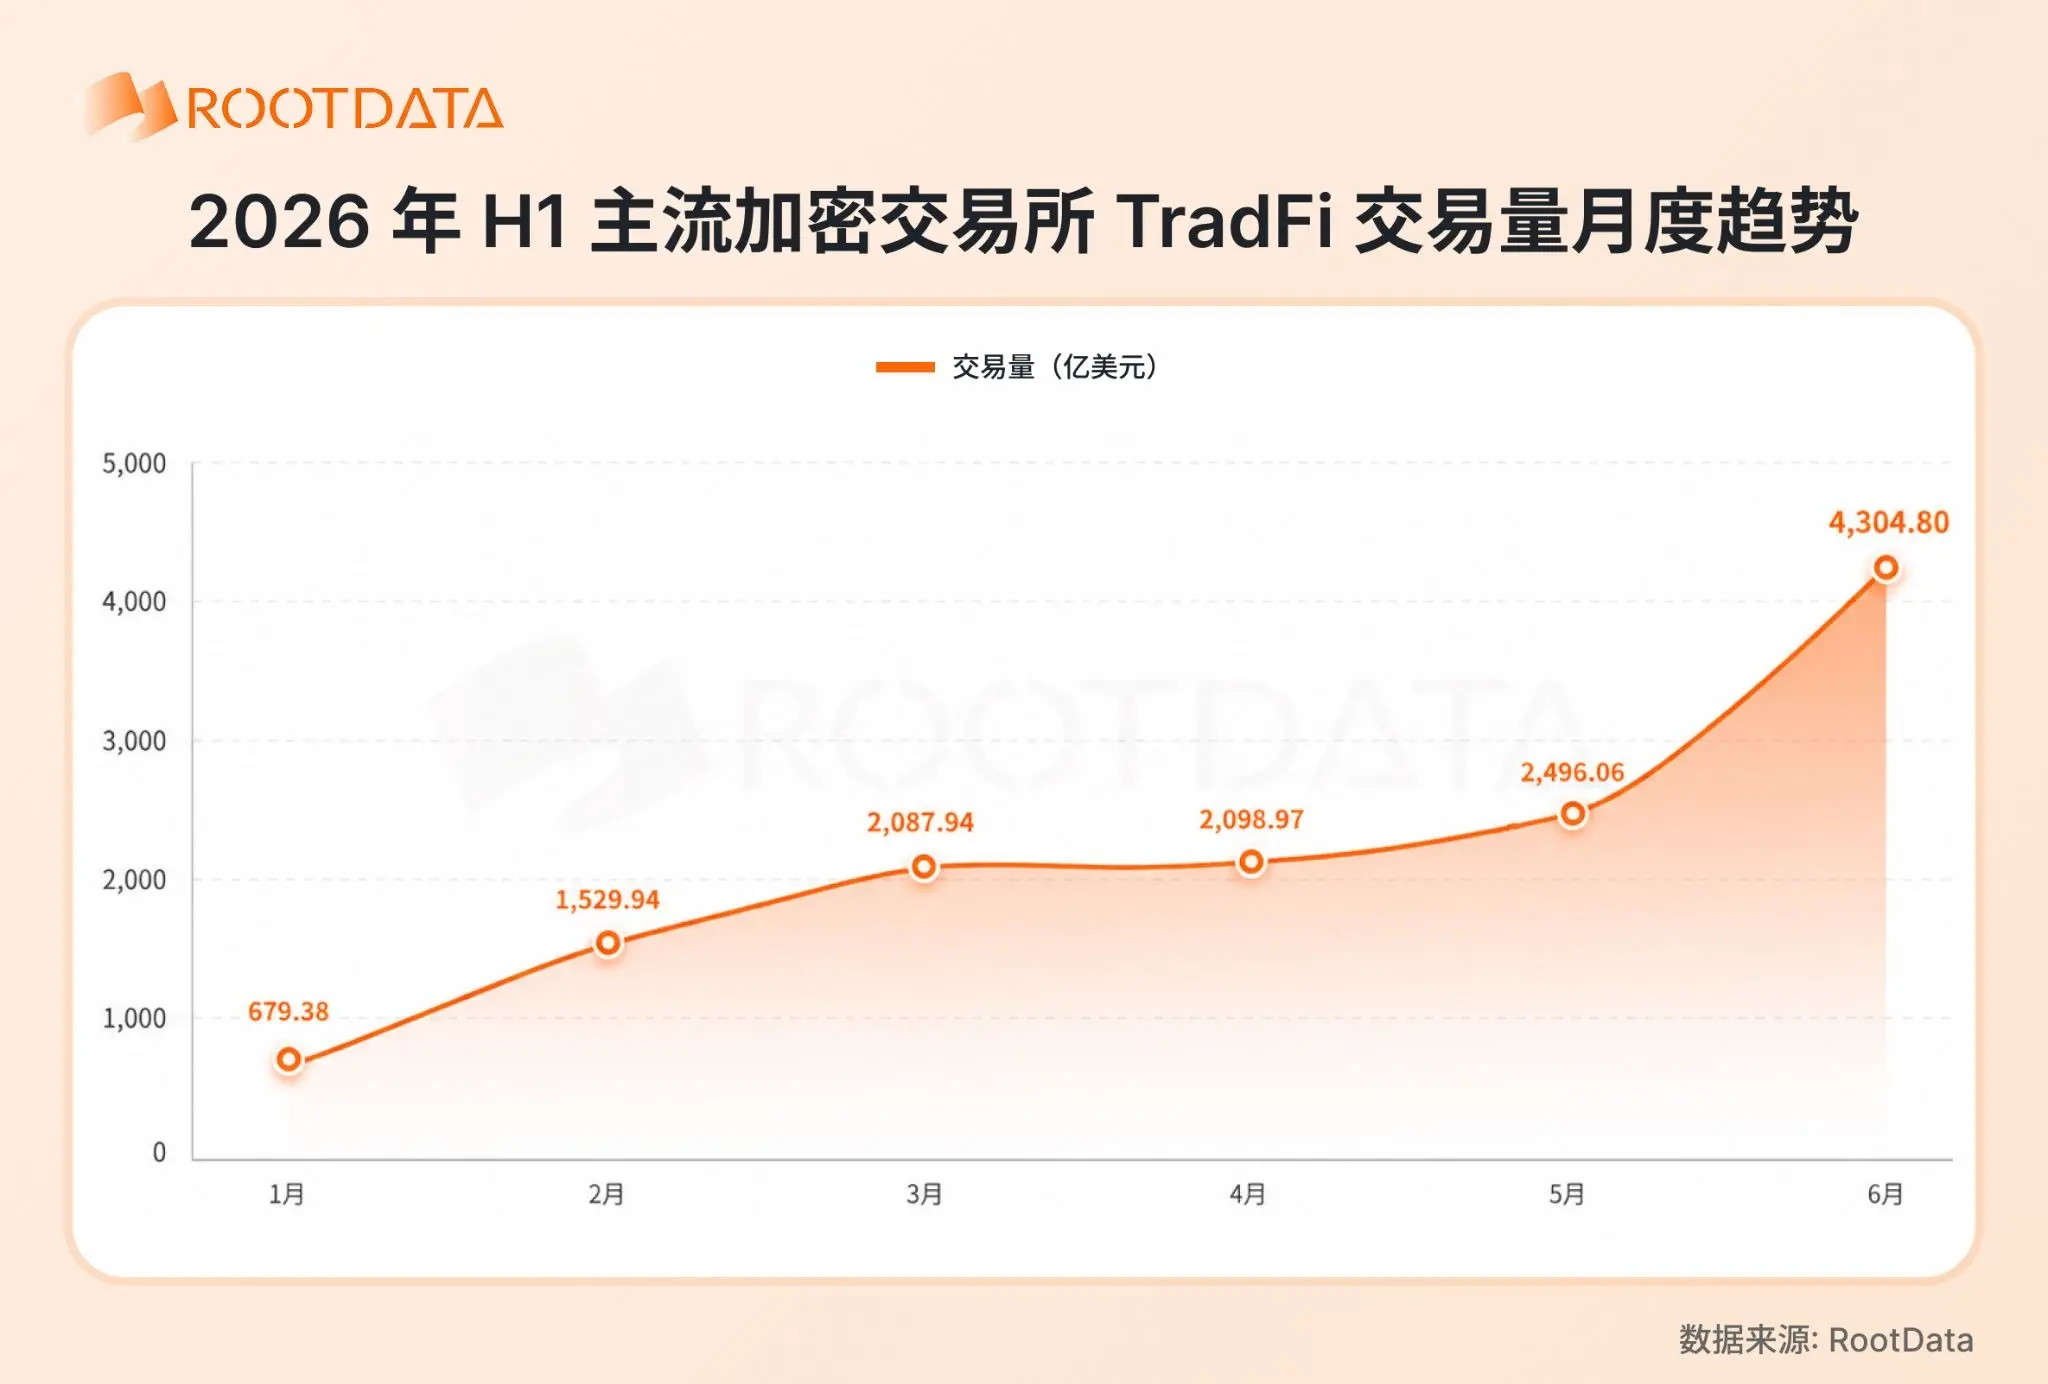
From a monthly trend perspective, January's trading volume was $67.94 billion, with market focus still on precious metal tokens like gold, and the spot trading ratio of 7.48% reflecting the brief heat of precious metal RWAs at the beginning of the year. Starting in February, the TradFi trading scale surged by 125.2% month-on-month to $152.99 billion, breaking the hundred billion mark; in June, it again grew by 72.5% month-on-month to $430.48 billion, setting a new high for the first half of the year.
The trading volume in June alone reached 6.3 times that of January, with the monthly average trading center moving from less than $70 billion at the beginning of the year to over $400 billion. If the second half of the year maintains the level of the first half, the annual trading volume of the TradFi track is expected to reach around $3 trillion.
2. Derivatives dominate the TradFi track
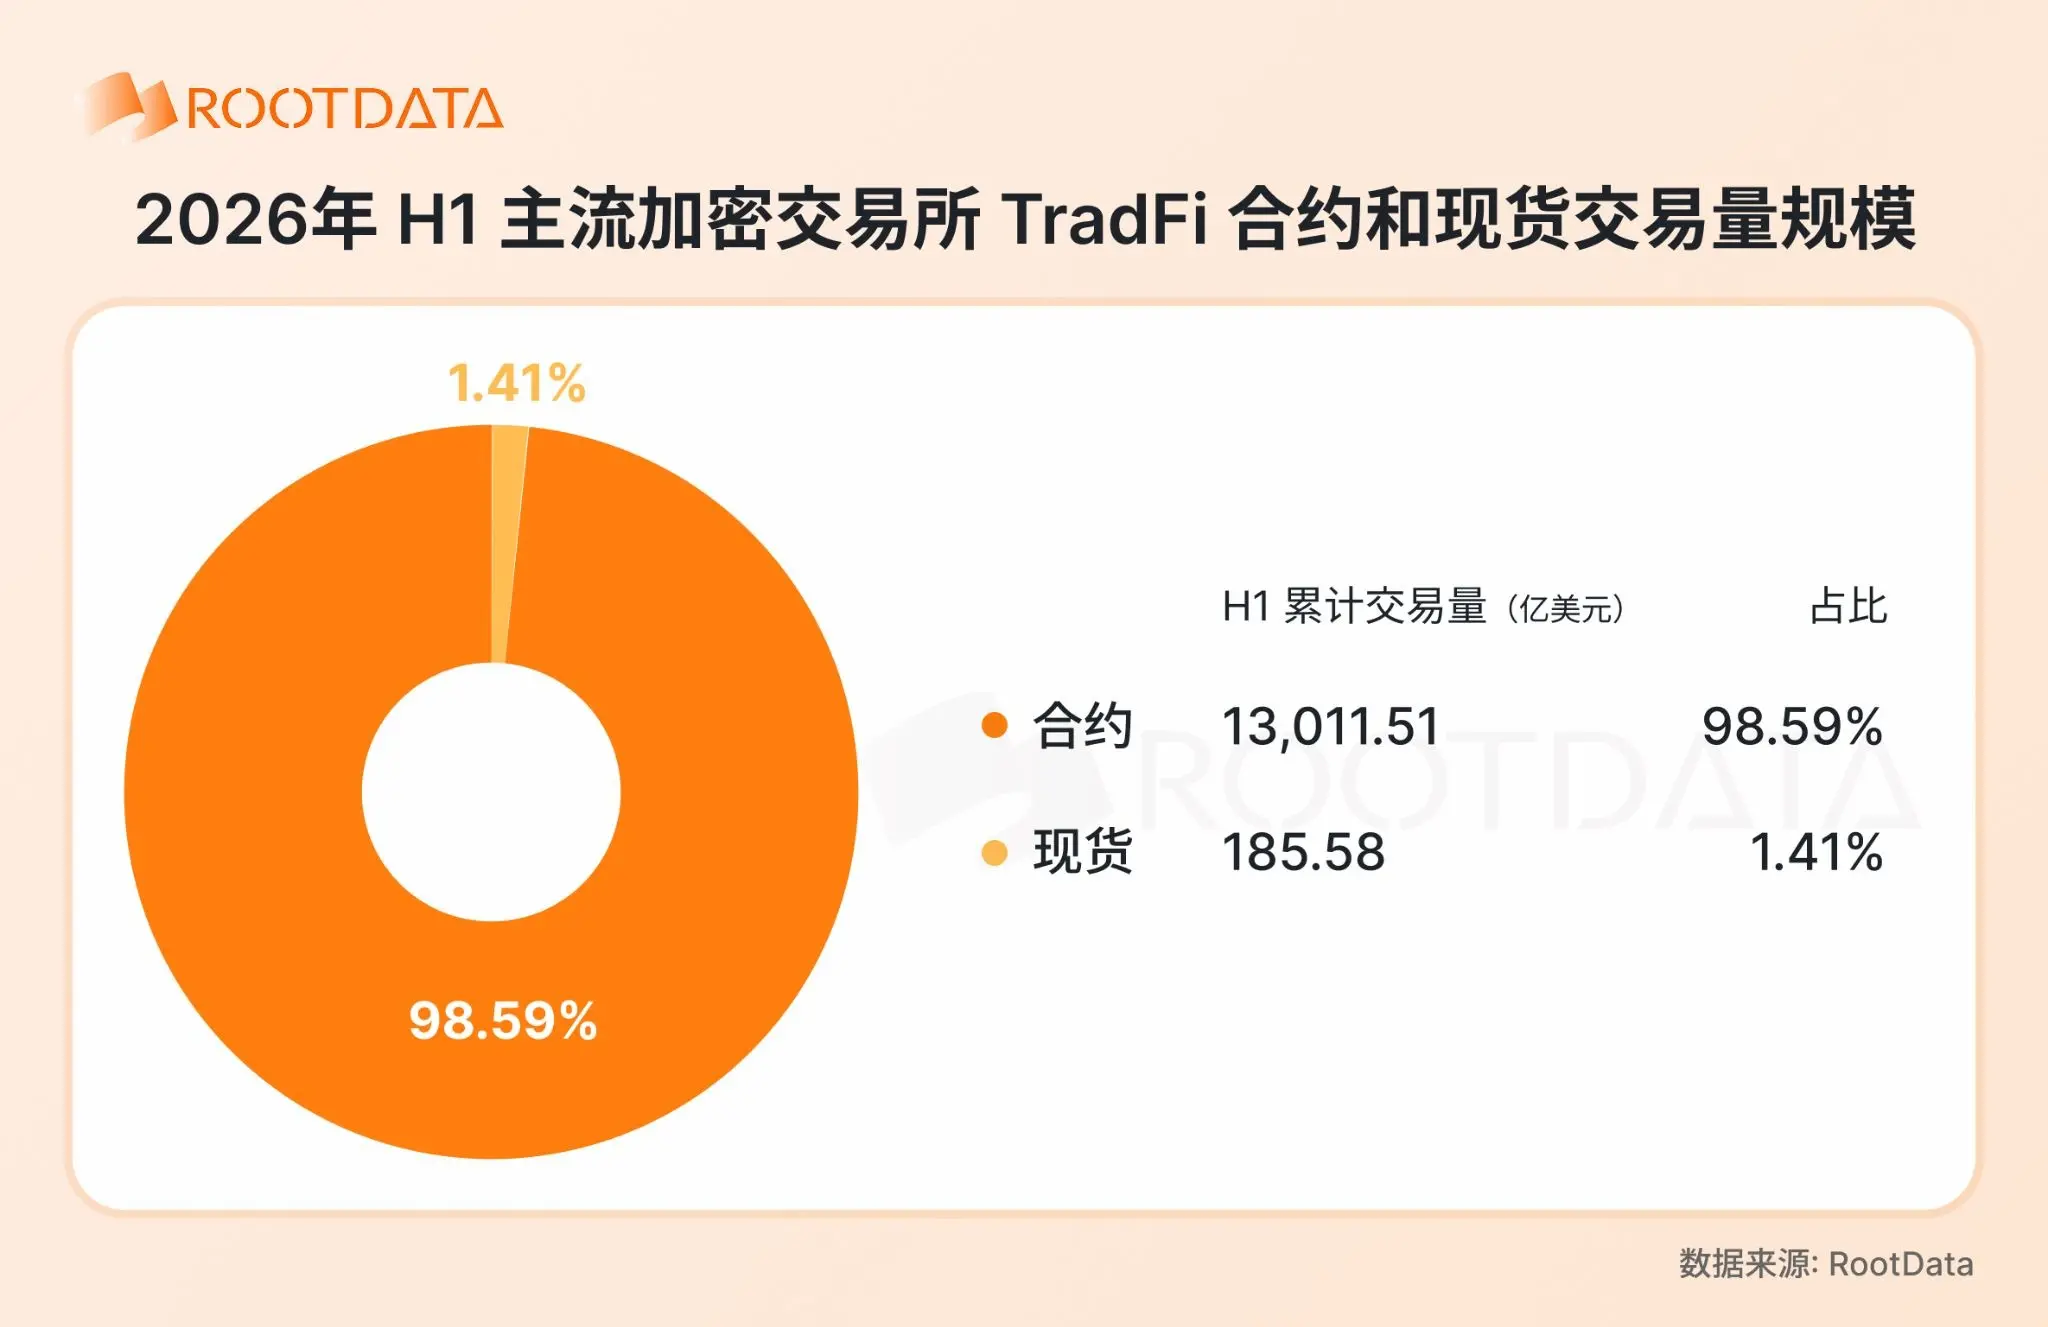
In the first half of 2026, contracts dominated the TradFi track, with a cumulative trading volume exceeding $1.3 trillion, accounting for 98.59%, making it the absolute main force of the TradFi track; spot trading was only $18.558 billion, accounting for less than 1.5%. The spot trading ratio of 7.48% in January was the highest for the first half of the year, quickly dropping below 2% and maintaining a low level, with the contract-dominated pattern gradually established since February.
Among them, stock derivatives are dominant. In terms of asset coverage, the five major exchanges have launched TradFi contract targets, with over 90% being stocks and stock ETFs. From the position data in the first half of 2026, the position sizes of popular TradFi assets represented by SNDK, SPCX, SK Hynix, and XAU are also growing significantly, with the open interest (OI) of the XAU gold contract once exceeding $700 million and the peak OI of SPCX exceeding $500 million.
II. Current Competitive Landscape of Crypto Exchanges in TradFi
1. Trading volume share: From Binance's "dominance" to multi-tier competition
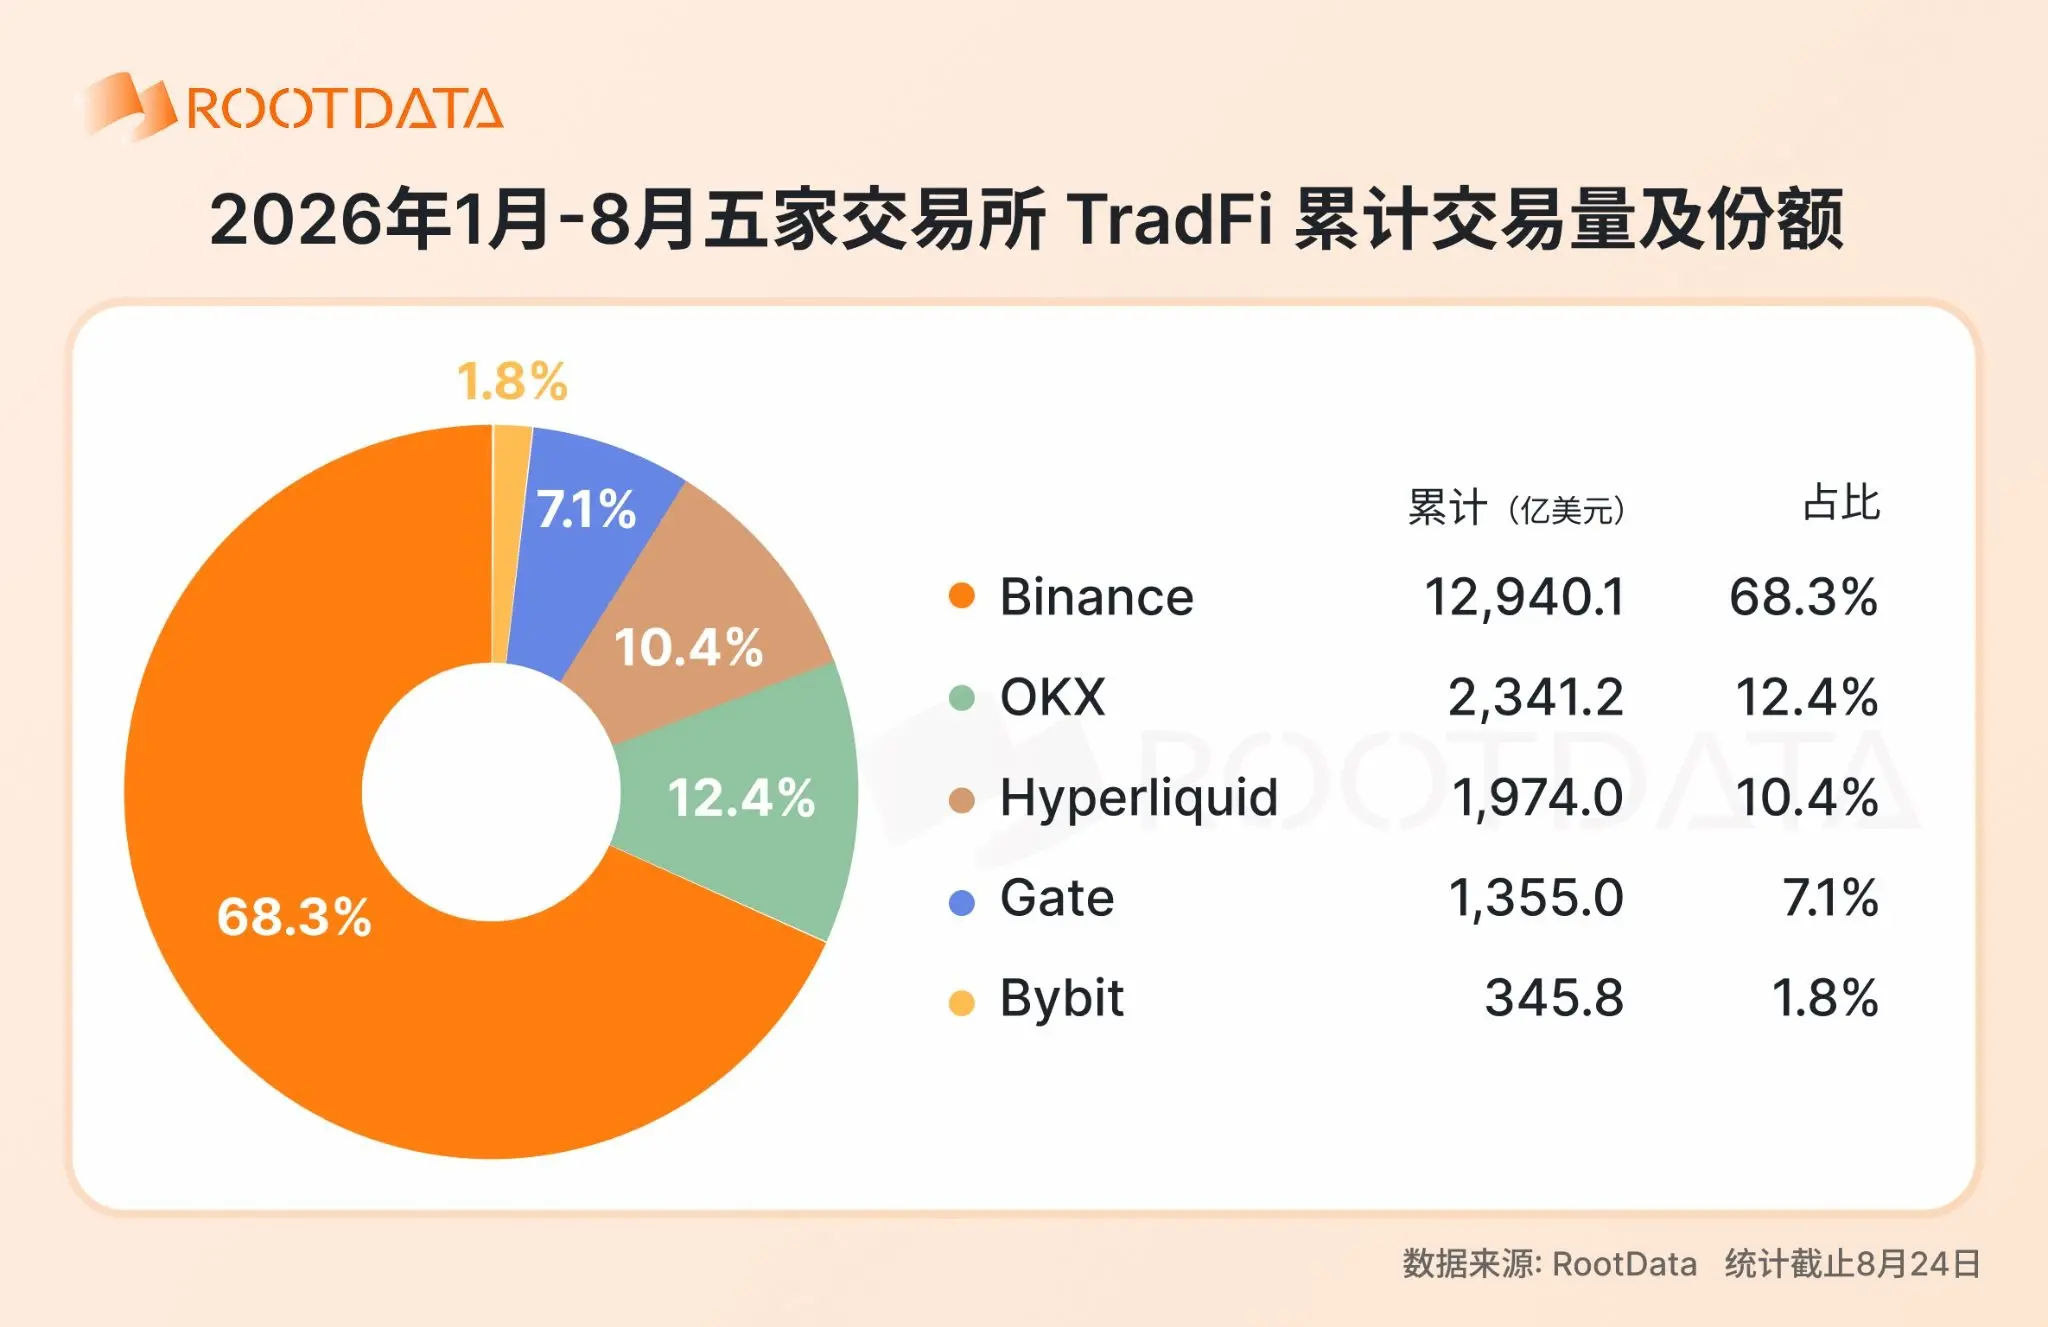
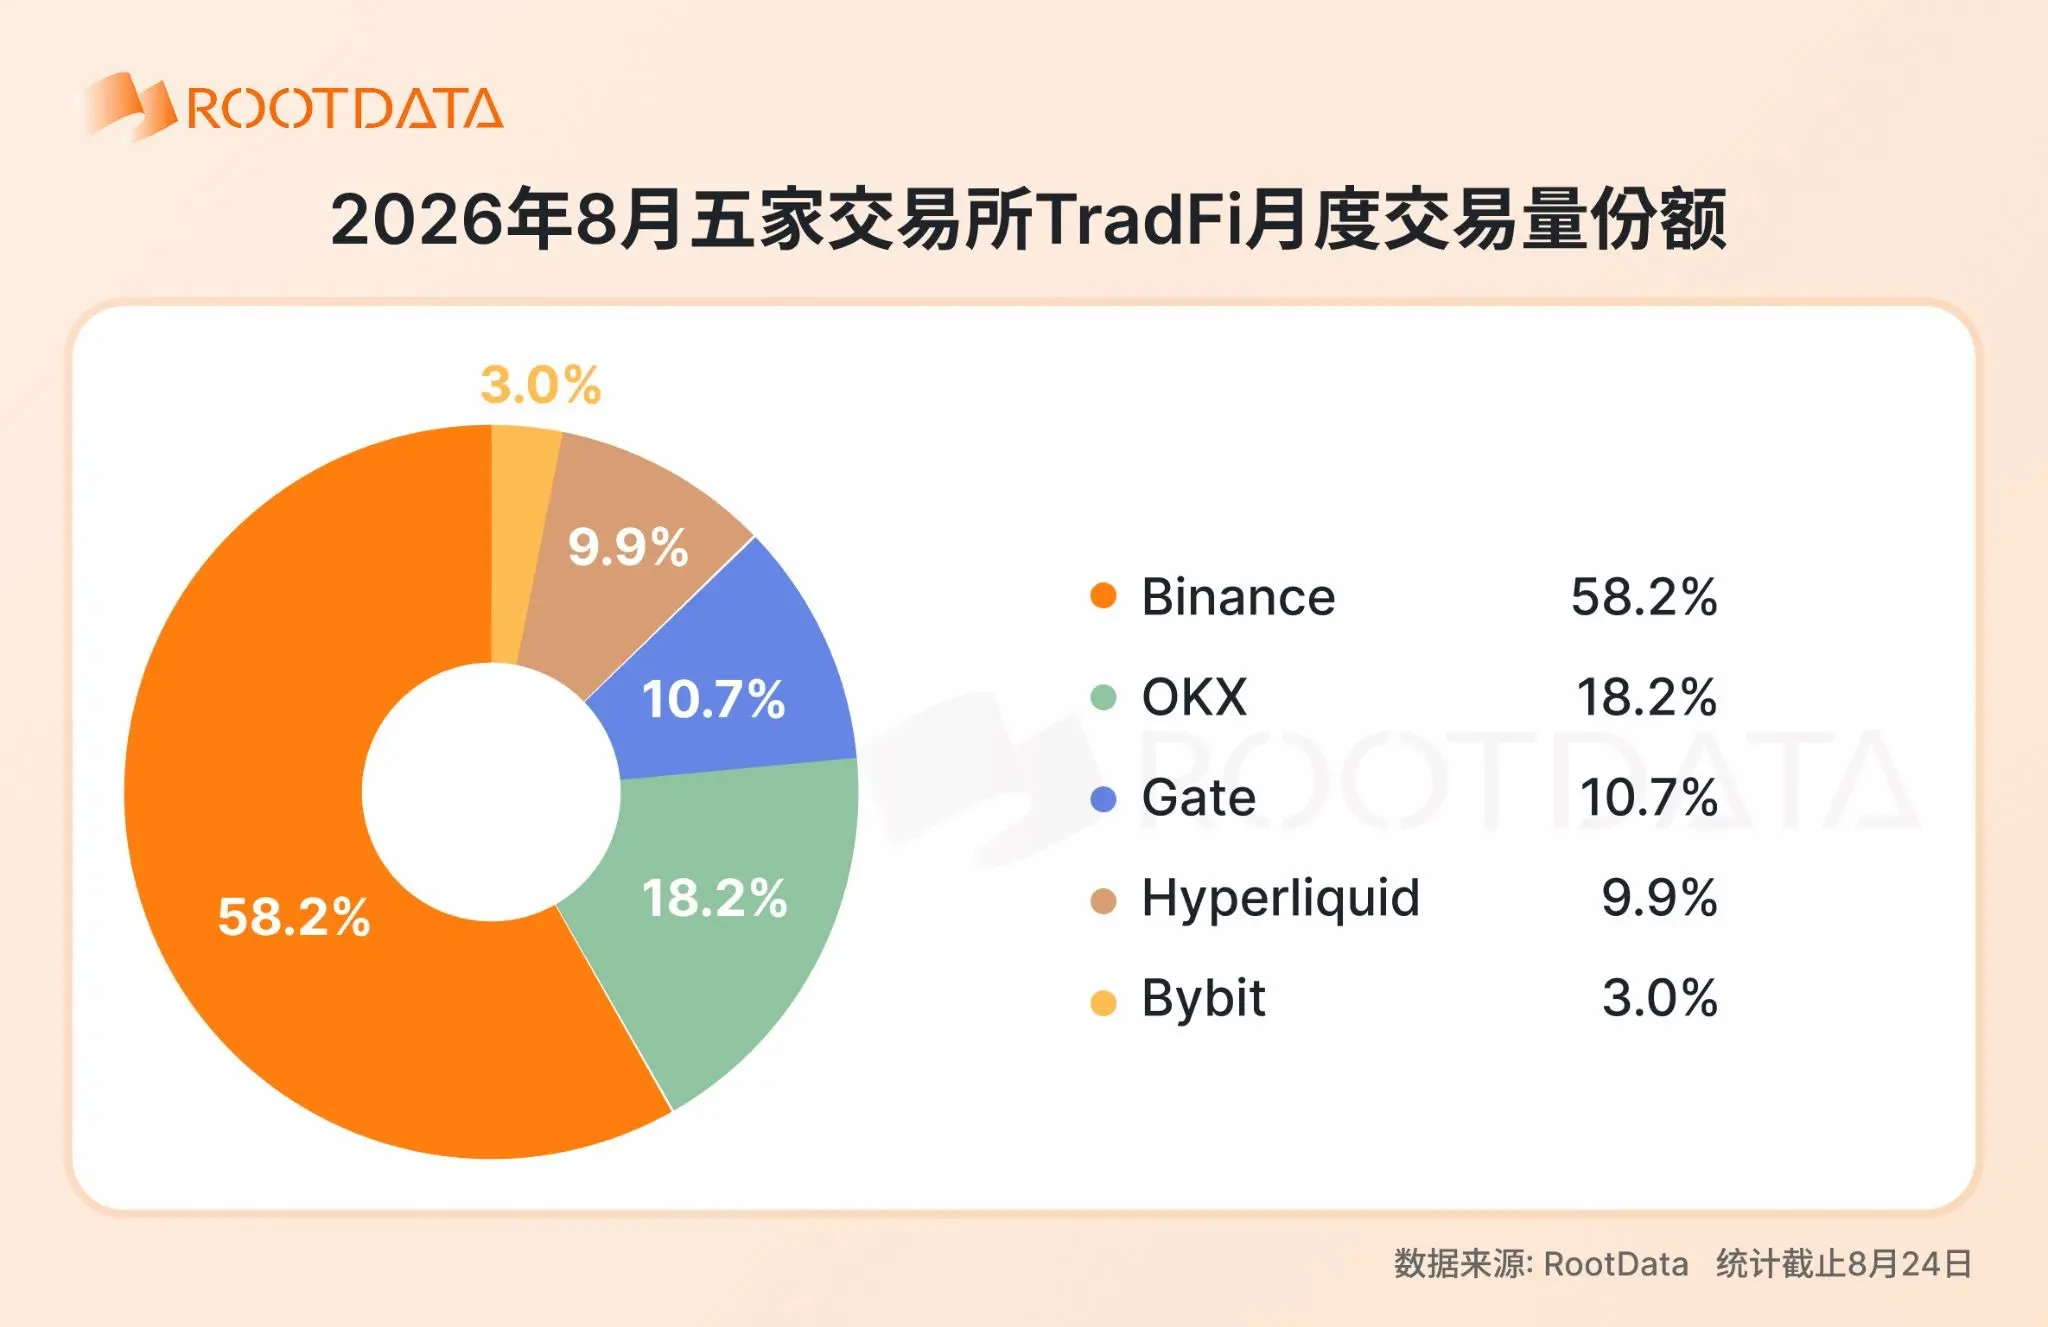
The flow concentration in the TradFi track is undergoing structural changes. From the cumulative data from January 2026 to August 24, the total TradFi trading volume of five exchanges is approximately $1.90 trillion, with Binance leading at $1.29 trillion, holding a 68.3% share, still the absolute leader. However, when viewed from a monthly perspective, Binance's share has gradually decreased from 78.8% in January to 58.2% in August, a decline of over 20 percentage points.
At the same time, the second tier is rapidly expanding. OKX, which had almost no TradFi transactions at the beginning of the year, has gradually increased to 18.2% in August, rising to second place; Hyperliquid rose to 10.7% in May and maintained above 10%, peaking at 13.3% in July; Gate's share fluctuated between 3.7% and 13.5%, rebounding to 10.7% in August; Bybit also climbed from 0.3% to 3.0%. This indicates that the funds in the TradFi track are no longer concentrated in a single platform but are showing a clear trend of multipolar diversion.
2. Position accumulation: Differentiation in user trading behavior across platforms
As of August (up to the 24th), the five exchanges' average daily open interest (OI) for TradFi contracts totaled approximately $7.304 billion. Binance ranked first with $3.455 billion, accounting for 47.3%; Hyperliquid ranked second with $1.956 billion and a 26.8% share; Gate's average daily OI was about $903 million, ranking third with 12.4%; OKX and Bybit were at 8.0% and 5.6%, respectively.
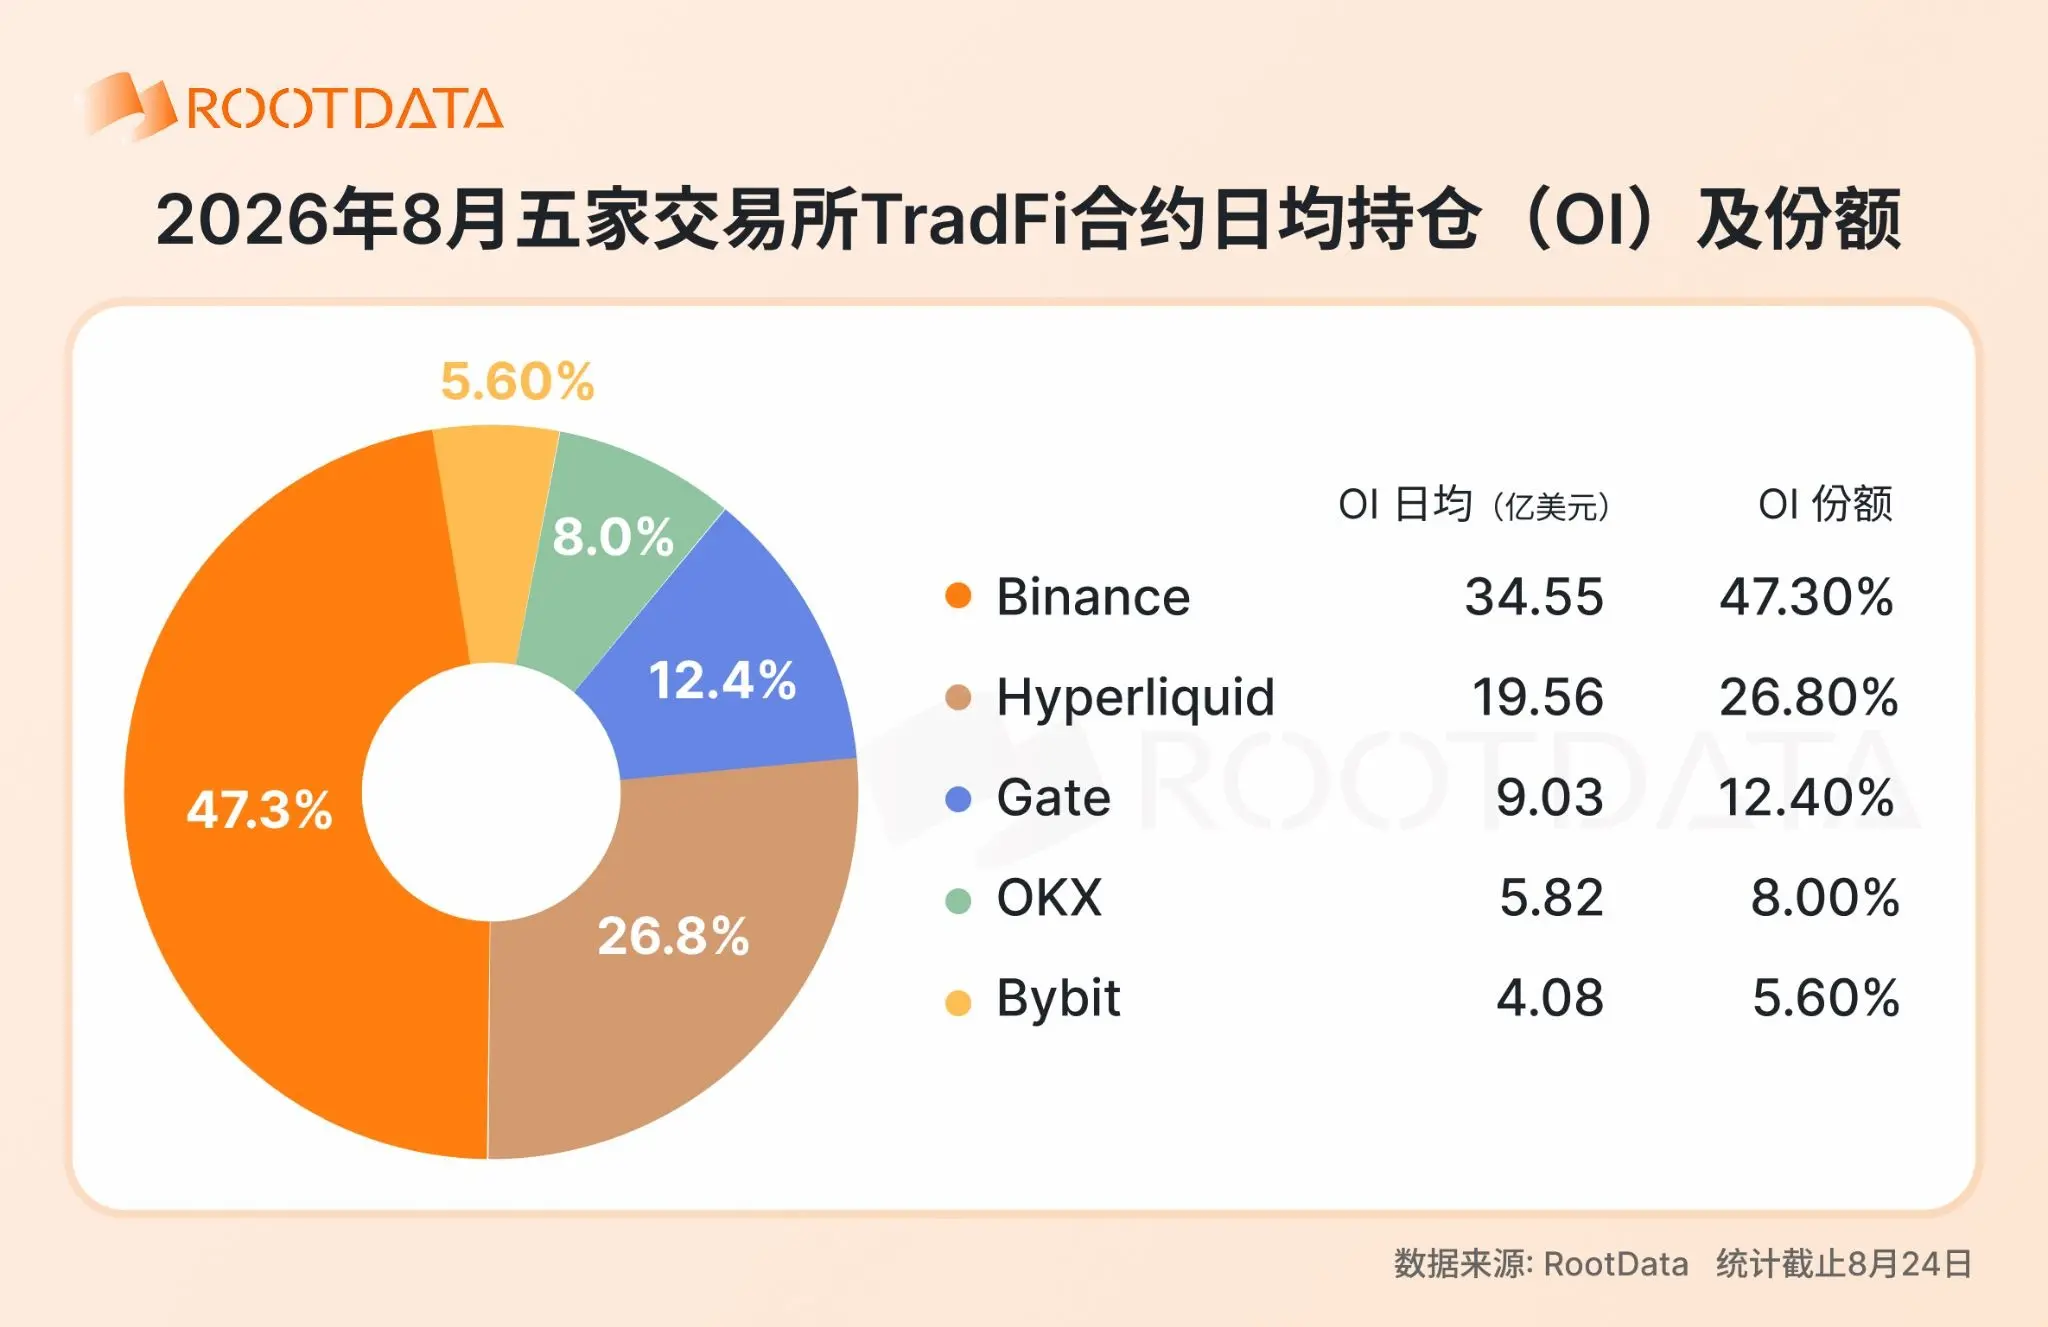
Hyperliquid's OI share (26.8%) is much higher than its trading volume share (about 9.9%), indicating that the positions it can accumulate per unit trading volume are significantly higher than those of other platforms; Gate's OI share (12.4%) is also higher than its trading volume share (10.7%). In contrast, OKX's trading volume share (18.2%) is significantly higher than its OI share (8.0%). This discrepancy indicates that different platforms have fundamentally different "uses" for TradFi assets, with some leaning towards high-frequency trading and others towards position accumulation.
3. Significant differences in asset coverage numbers reflect different expansion strategies of platforms
As of the latest data on August 24, the number of TradFi assets across the five exchanges shows a polarized distribution. Gate reached 1,022, with OKX in second place at 242 and Binance in third at 229. Gate's coverage is 4.2 times that of second-place OKX, showing a very clear gap.
This magnitude difference reflects two entirely different platform strategies. Gate follows a "broad coverage" route, with the most comprehensive range of asset listings, covering major global stock markets such as US, Hong Kong, Korean, and Japanese stocks. Additionally, its listing speed is relatively fast, meeting cross-market and multi-theme allocation needs by quickly launching a large number of targets; while Binance, OKX, Hyperliquid, and Bybit adopt a "curated" strategy, controlling the number of targets within the range of 100 to 250, focusing more on market making and liquidity investment in core assets.
III. How is the stock derivatives market evolving?
Stock derivatives, which dominate trading volume, are currently the most noteworthy sub-market. RootData's ranking of stock derivatives exchanges discards the sole focus on trading volume and provides a comprehensive score for exchanges supporting stock derivatives trading based on trading volume, open interest, spreads, depth, trading costs, and data collectability.
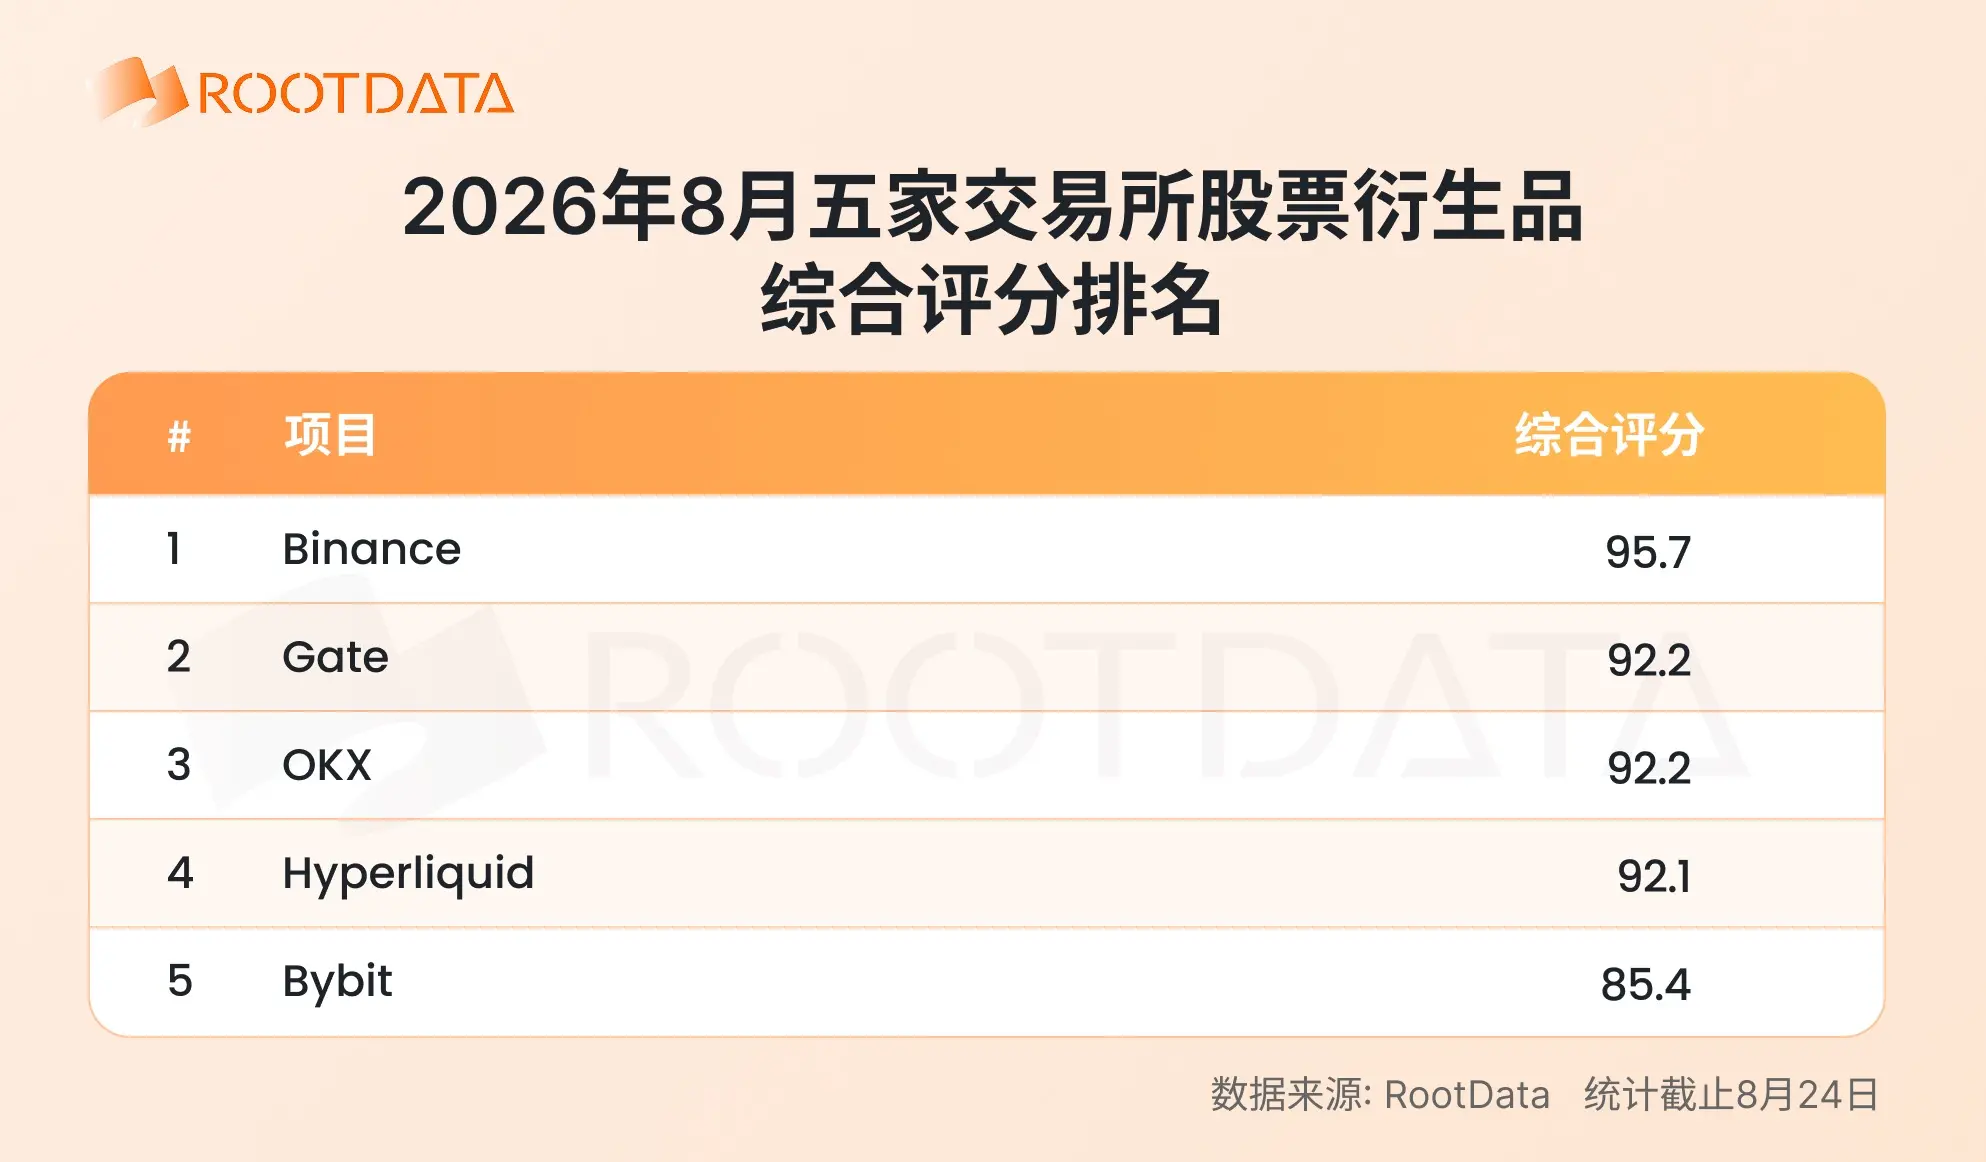
From the data in August (up to the 24th), in terms of comprehensive scoring, Binance ranks first with 95.7 points, while Gate and OKX both score 92.2 points, tied for second place, followed closely by Hyperliquid with 92.1 points, and Bybit with 85.4 points. Below are the data conditions for each exchange across various dimensions.
1. Trading volume pattern: "One strong leader and many strong competitors" with differentiated growth momentum
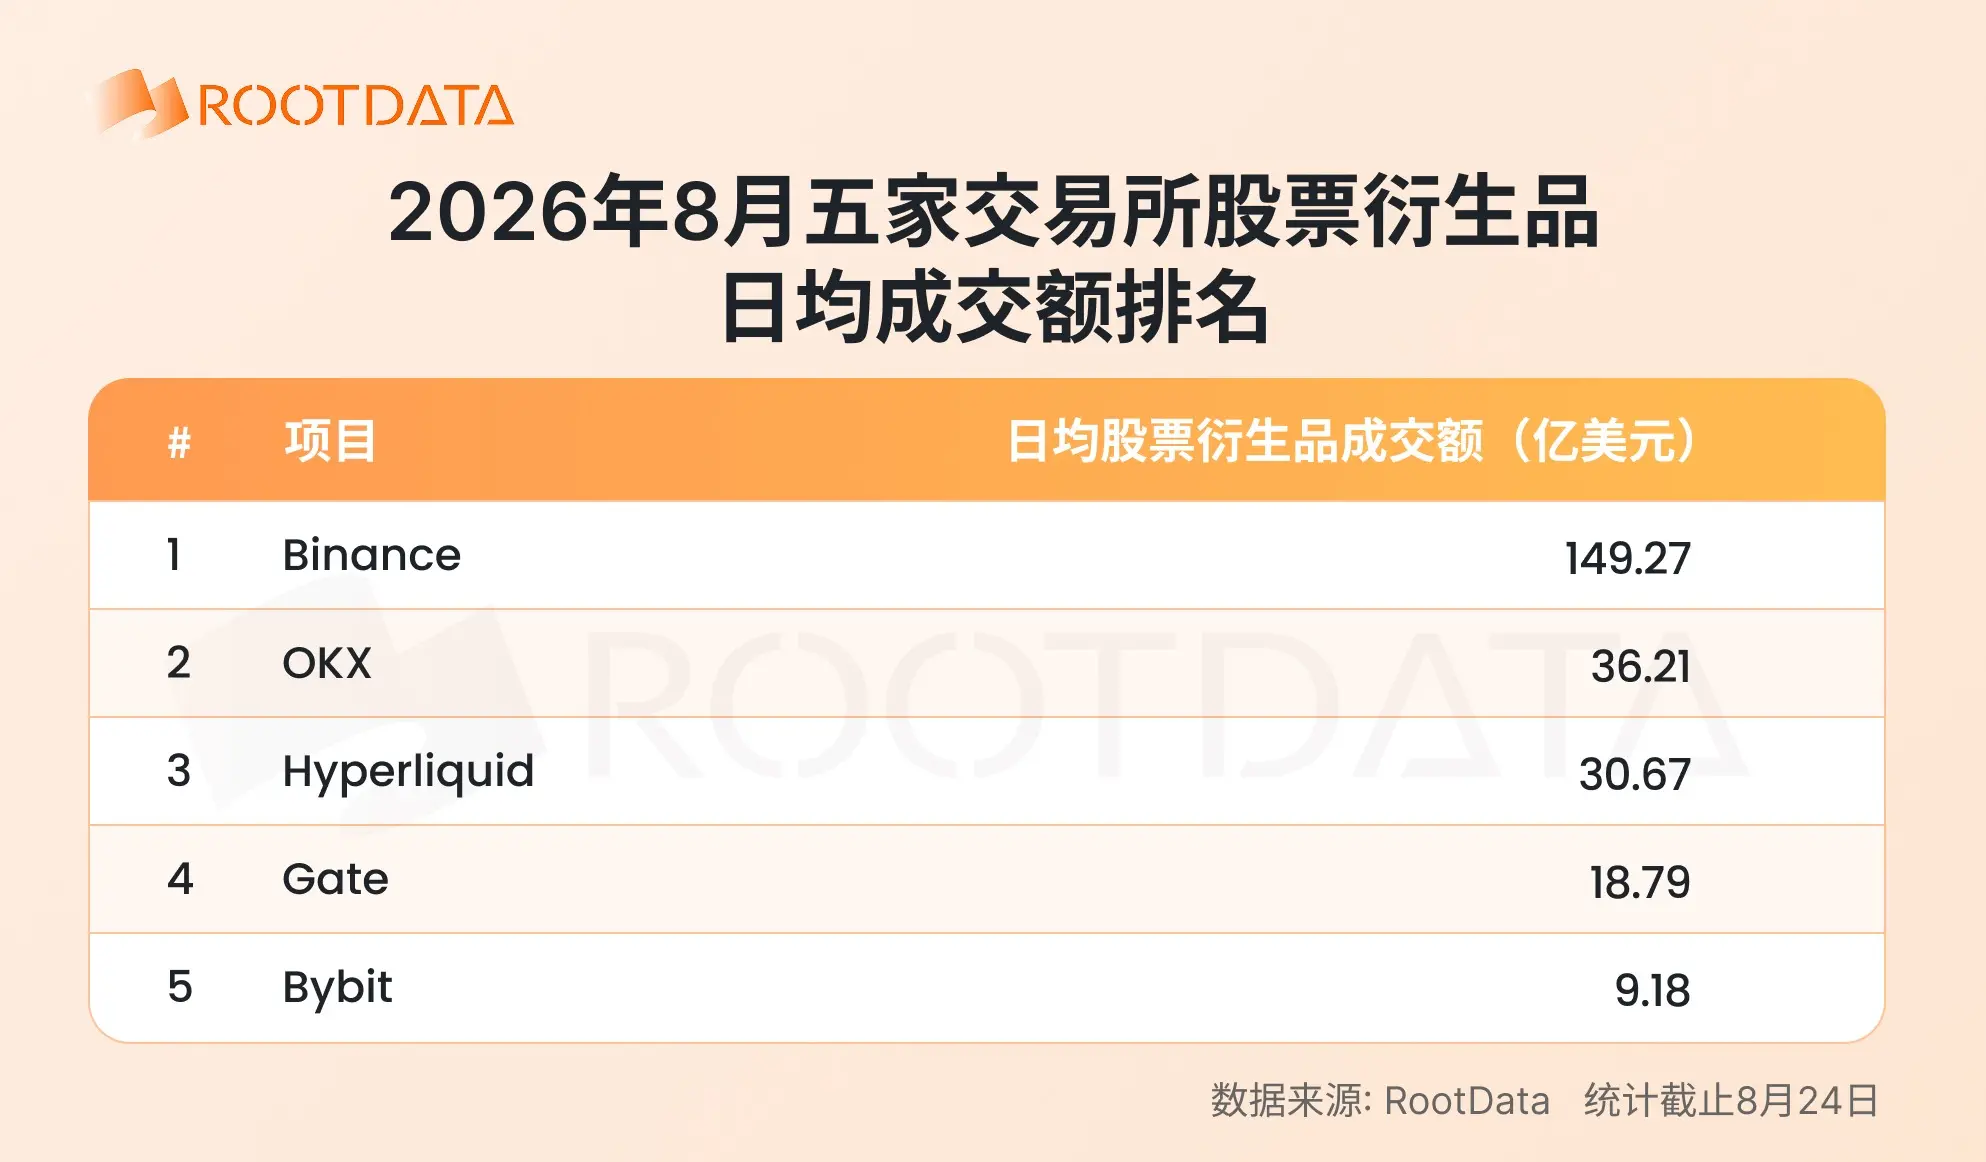
Trading volume remains the most intuitive measure of market position. Binance leads with an average daily trading volume of $14.927 billion, 4.1 times that of second-place OKX ($3.621 billion), occupying an absolute dominant position, with the industry showing a typical "one strong leader and many strong competitors" pattern. OKX and Hyperliquid rank second and third, with average daily trading volumes of $3.621 billion and $3.067 billion, respectively, at the same level; Gate has an average of $1.879 billion, while Bybit has $918 million.
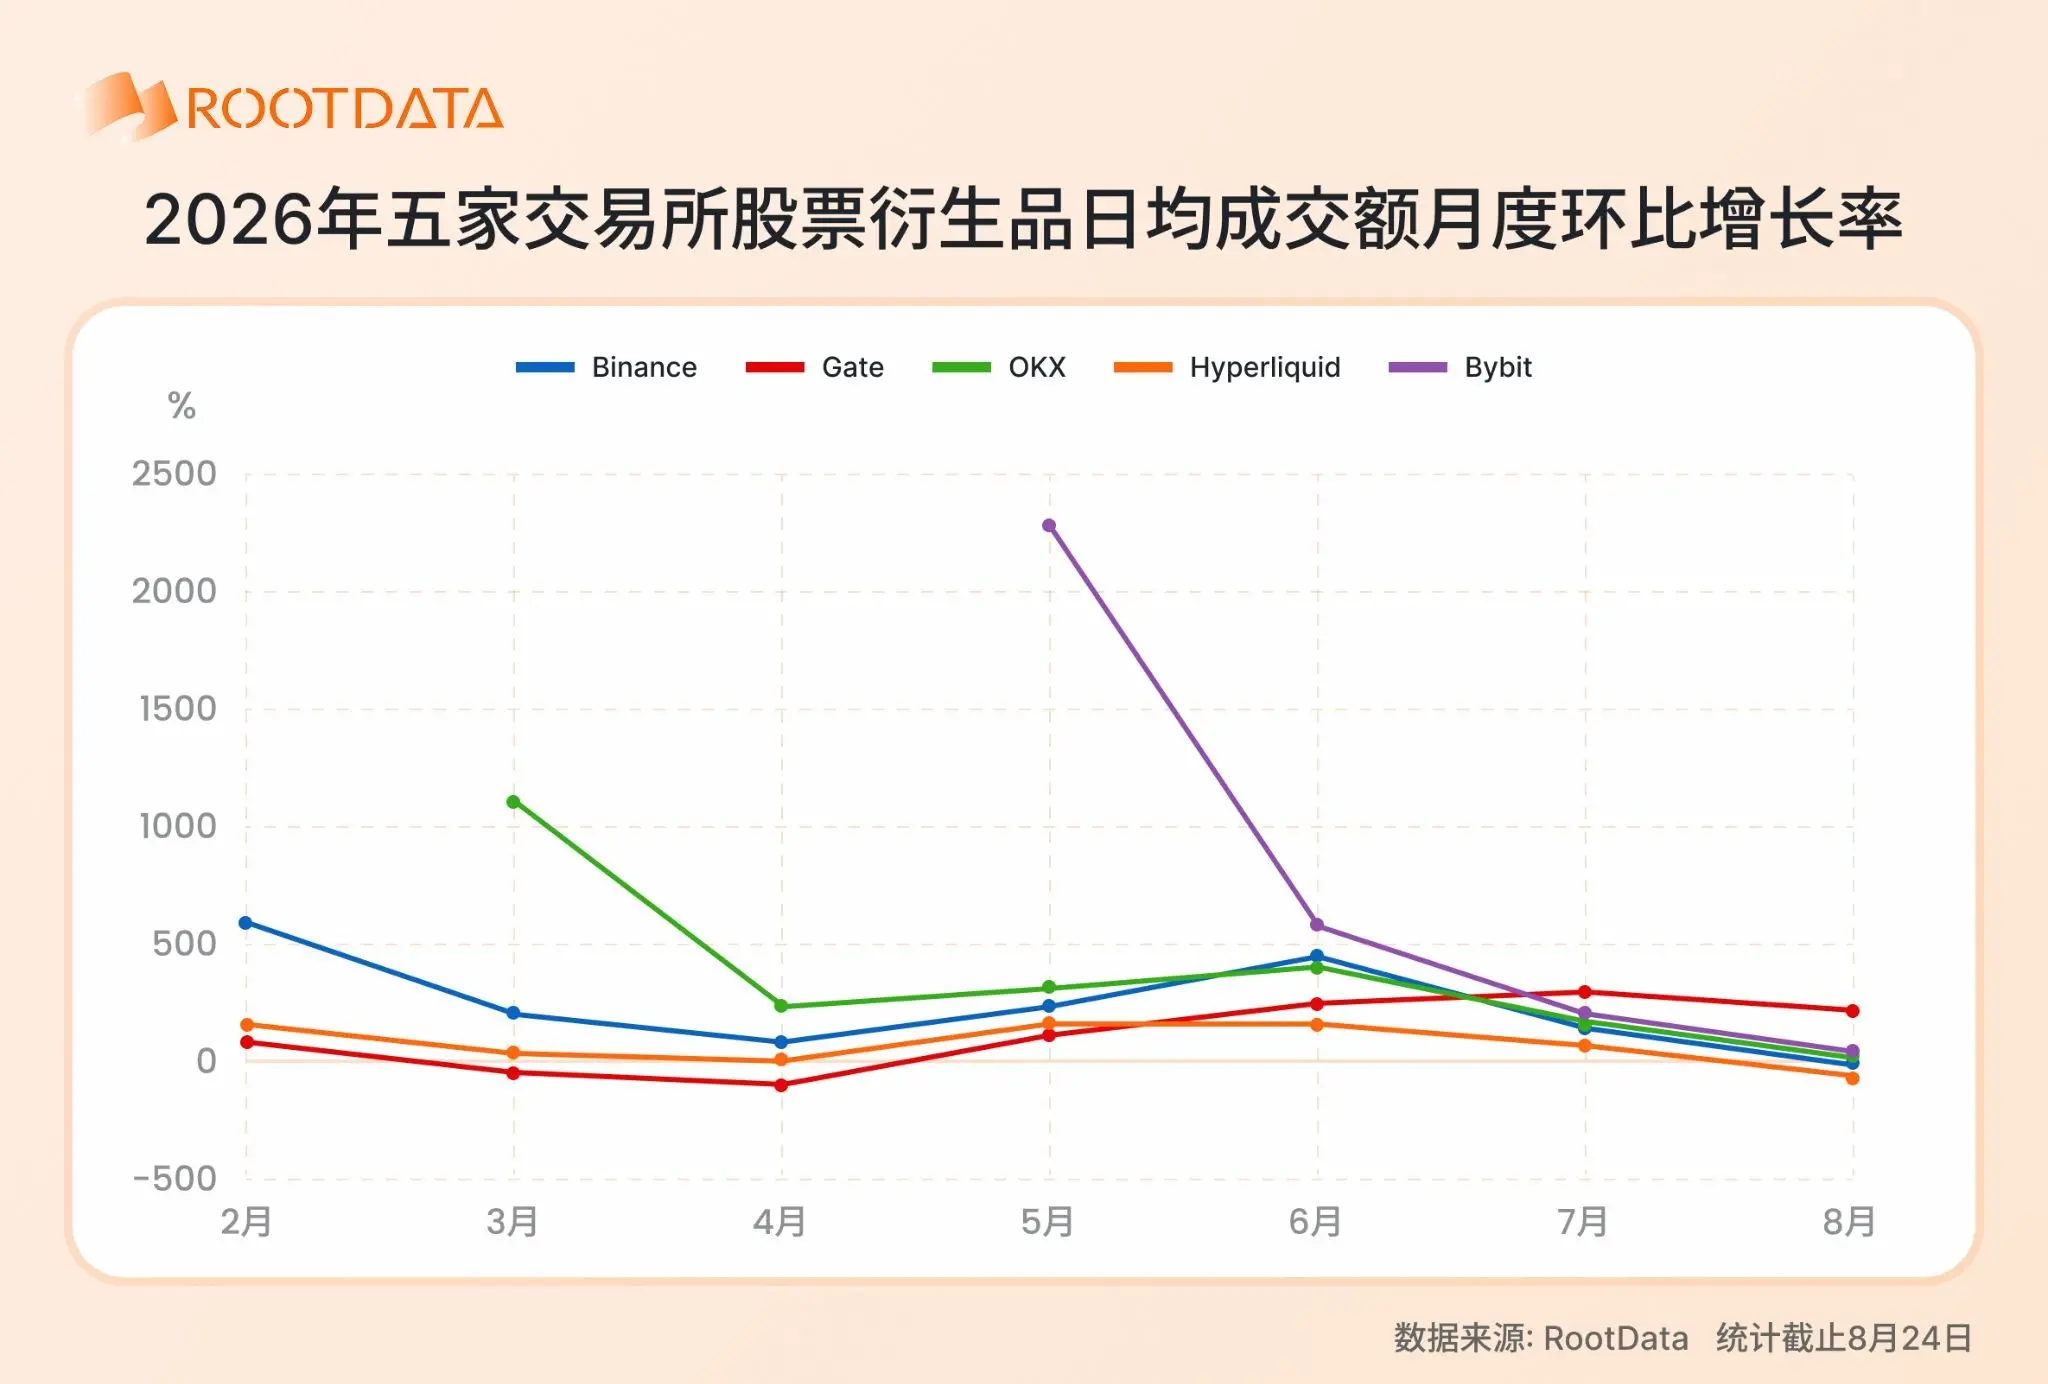
However, the trading volume figures only tell one side of the story; the month-on-month growth rate also reveals trends in capital flow. From February to August, the daily average trading scale month-on-month showed that the industry peaked in growth rate in June, followed by a digestion period in July and August due to the "high base." In this context, the growth momentum of each platform has shown significant differentiation.
As the absolute leader, Binance's month-on-month growth rate reached as high as 467.9% in June, fell to 116.5% in July, and further dropped to 2.1% in August (up to the 24th), with both volume advantages and growth pressures coexisting, but the volume advantage remains solid. Hyperliquid also showed a pattern of high followed by low, while OKX and Bybit maintained positive growth, but their growth rates have significantly narrowed compared to the peaks in May and June. Gate's growth rate curve has shown an independent rhythm, continuously gaining momentum since May, with month-on-month growth rates of 124.1%, 187.3%, 323.7%, and 261.1% from May to August, maintaining triple-digit high growth for four consecutive months. Whether this sustained high growth can translate into further leaps in existing rankings will require observation of the subsequent months' base effects and capital retention.
2. Position structure: Differentiation of long and short strategies
In terms of positions, Binance holds the top spot with an average daily open interest of $3.472 billion, followed closely by Hyperliquid with $1.986 billion, reaching 57% of Binance's OI. Gate ranks third with an average daily position of $772 million, while OKX and Bybit are at $532 million and $194 million, respectively.
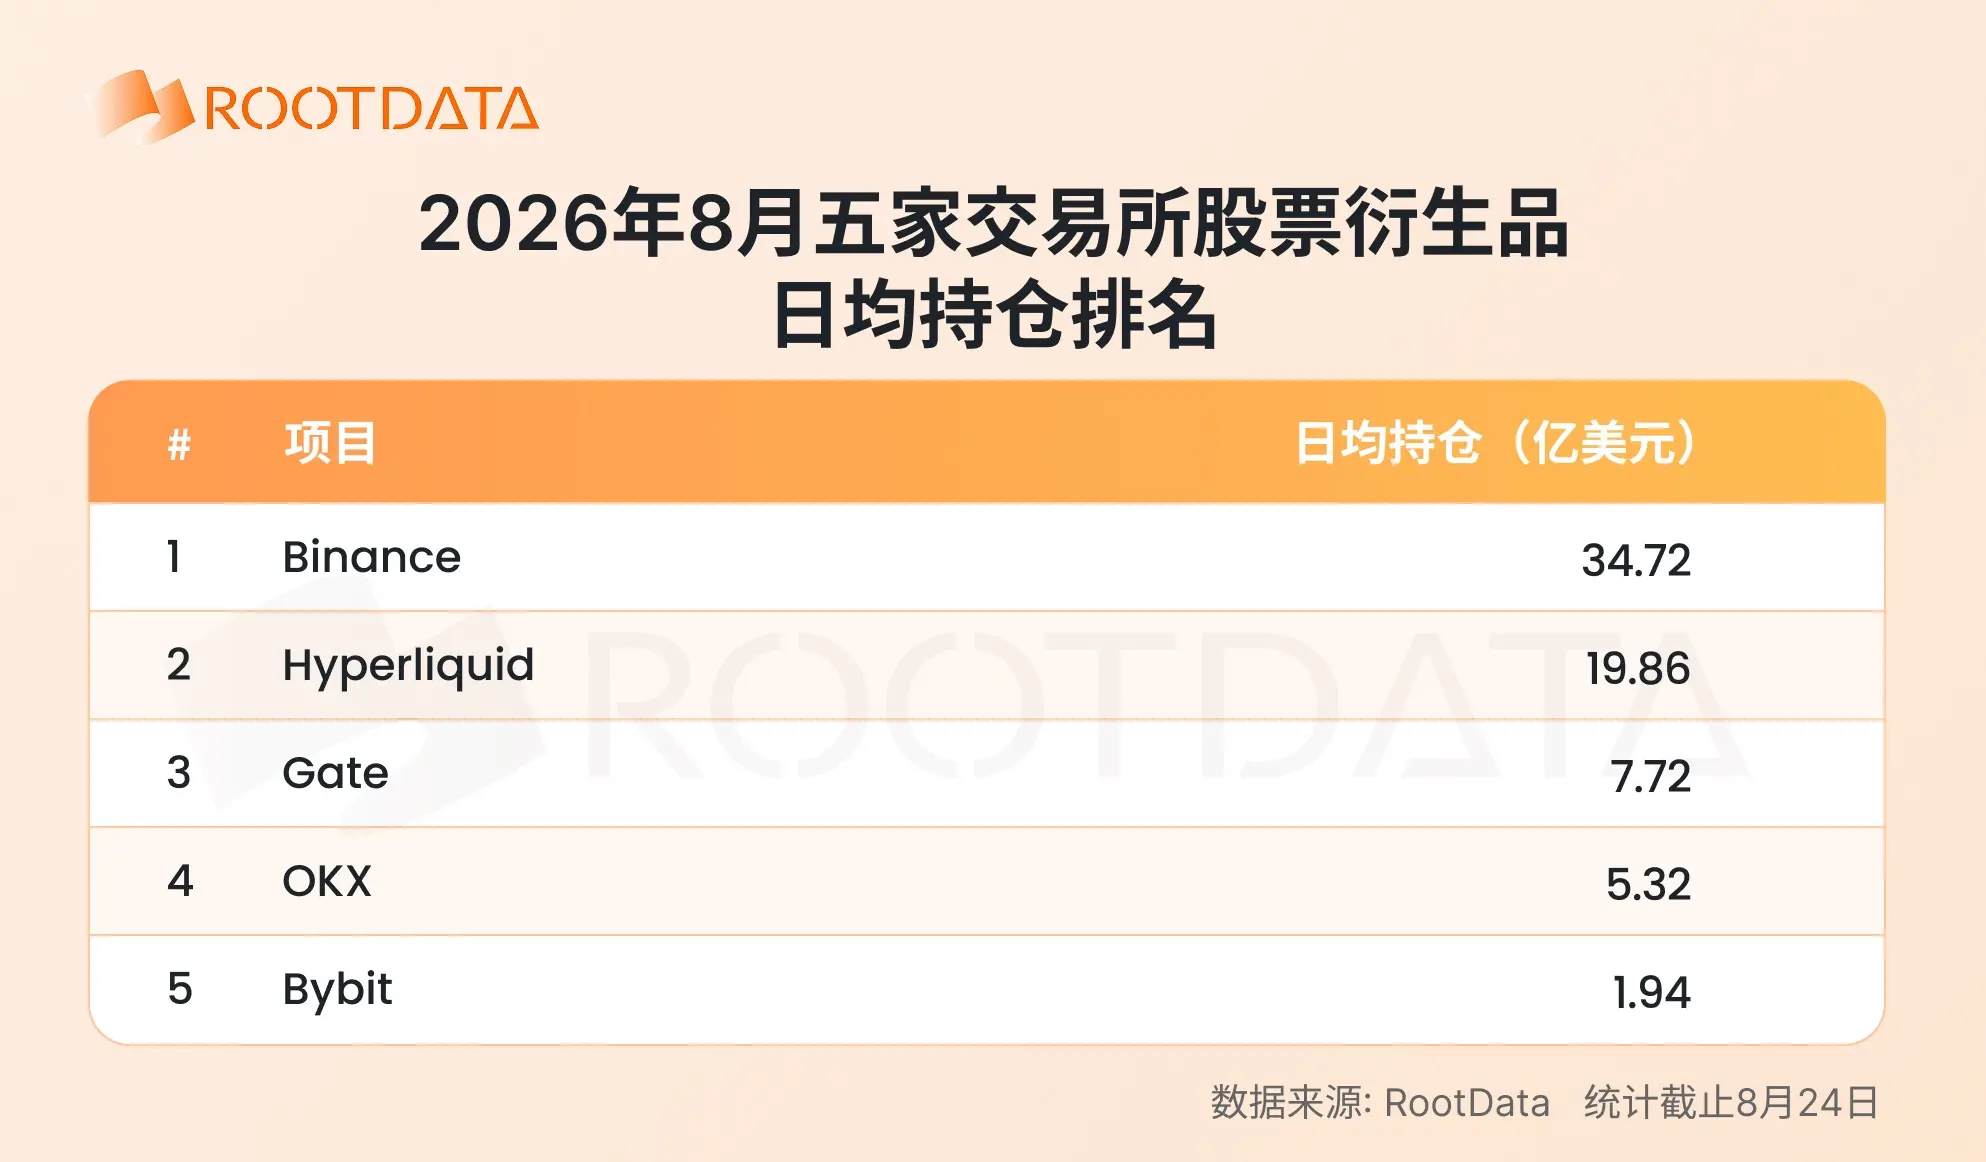
The OI/trading volume ratio of different platforms shows a clear differentiation in user behavior. Hyperliquid has a ratio of about 0.65, indicating that users tend to hold positions long-term after opening, reflecting a typical allocation characteristic; Gate's ratio is about 0.41, showing a relatively balanced long and short strategy; while OKX is only about 0.15 and Binance about 0.23, with the latter two leaning more towards high-frequency short-term trading. For TradFi assets like stock derivatives, the thickness of position accumulation often reflects the platform's user stickiness more than trading impulses; platforms with long-held positions usually indicate lower churn rates and higher capital retention efficiency.
3. Market depth: Gate ranked first in liquidity in mid-August, surpassing Binance for 11 consecutive trading days
According to liquidity monitoring data, since August 14, Gate's ±2% weighted depth has surpassed Binance for 11 consecutive trading days, ranking first in the industry. During this period, Gate's average daily weighted depth reached $14.678 million, while Binance's was $10.721 million.
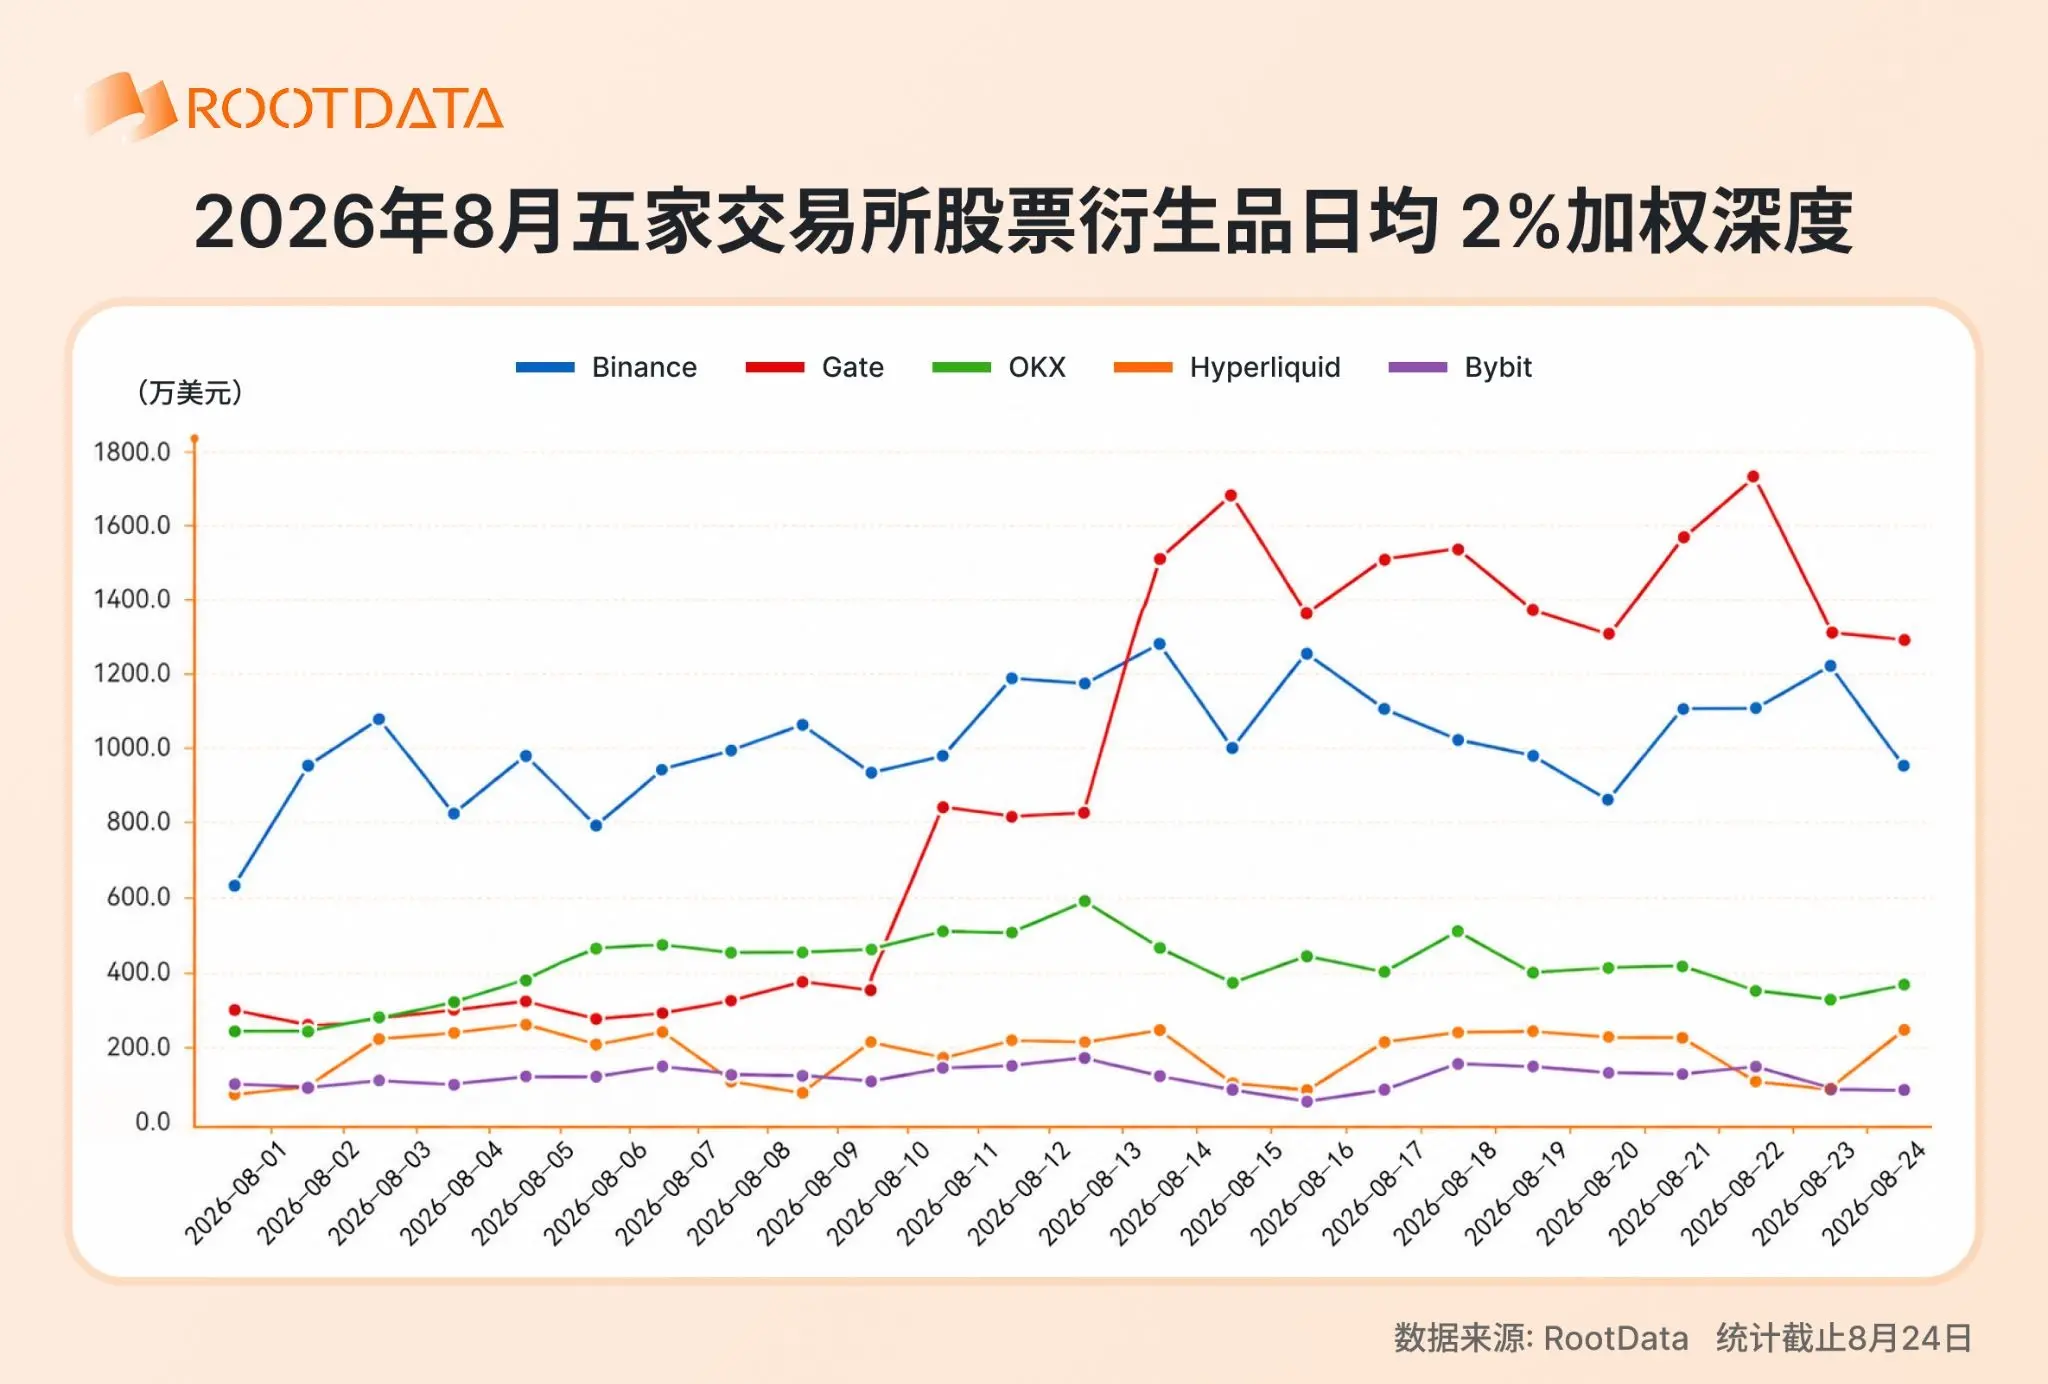
If we calculate based on the ±1% weighted depth, which is closer to actual trading ranges, Gate also maintains the top position after August 10, with an average daily depth of $7.499 million. Together, Gate and Binance account for about 71% of the liquidity share among comparable exchanges, further highlighting the concentration effect at the top of the industry.
Prior to this, the industry overall showed a "dual-head concentration" pattern, with Binance maintaining a long-term lead with an average daily ±2% weighted depth of $10.069 million, followed closely by Gate at $9.012 million, together accounting for over 70% of the industry's depth; OKX, Bybit, and Hyperliquid followed with $4.445 million, $1.788 million, and $1.171 million, respectively, showing a significant gap with the leading platforms.
4. Price spread levels of leading exchanges are relatively stable
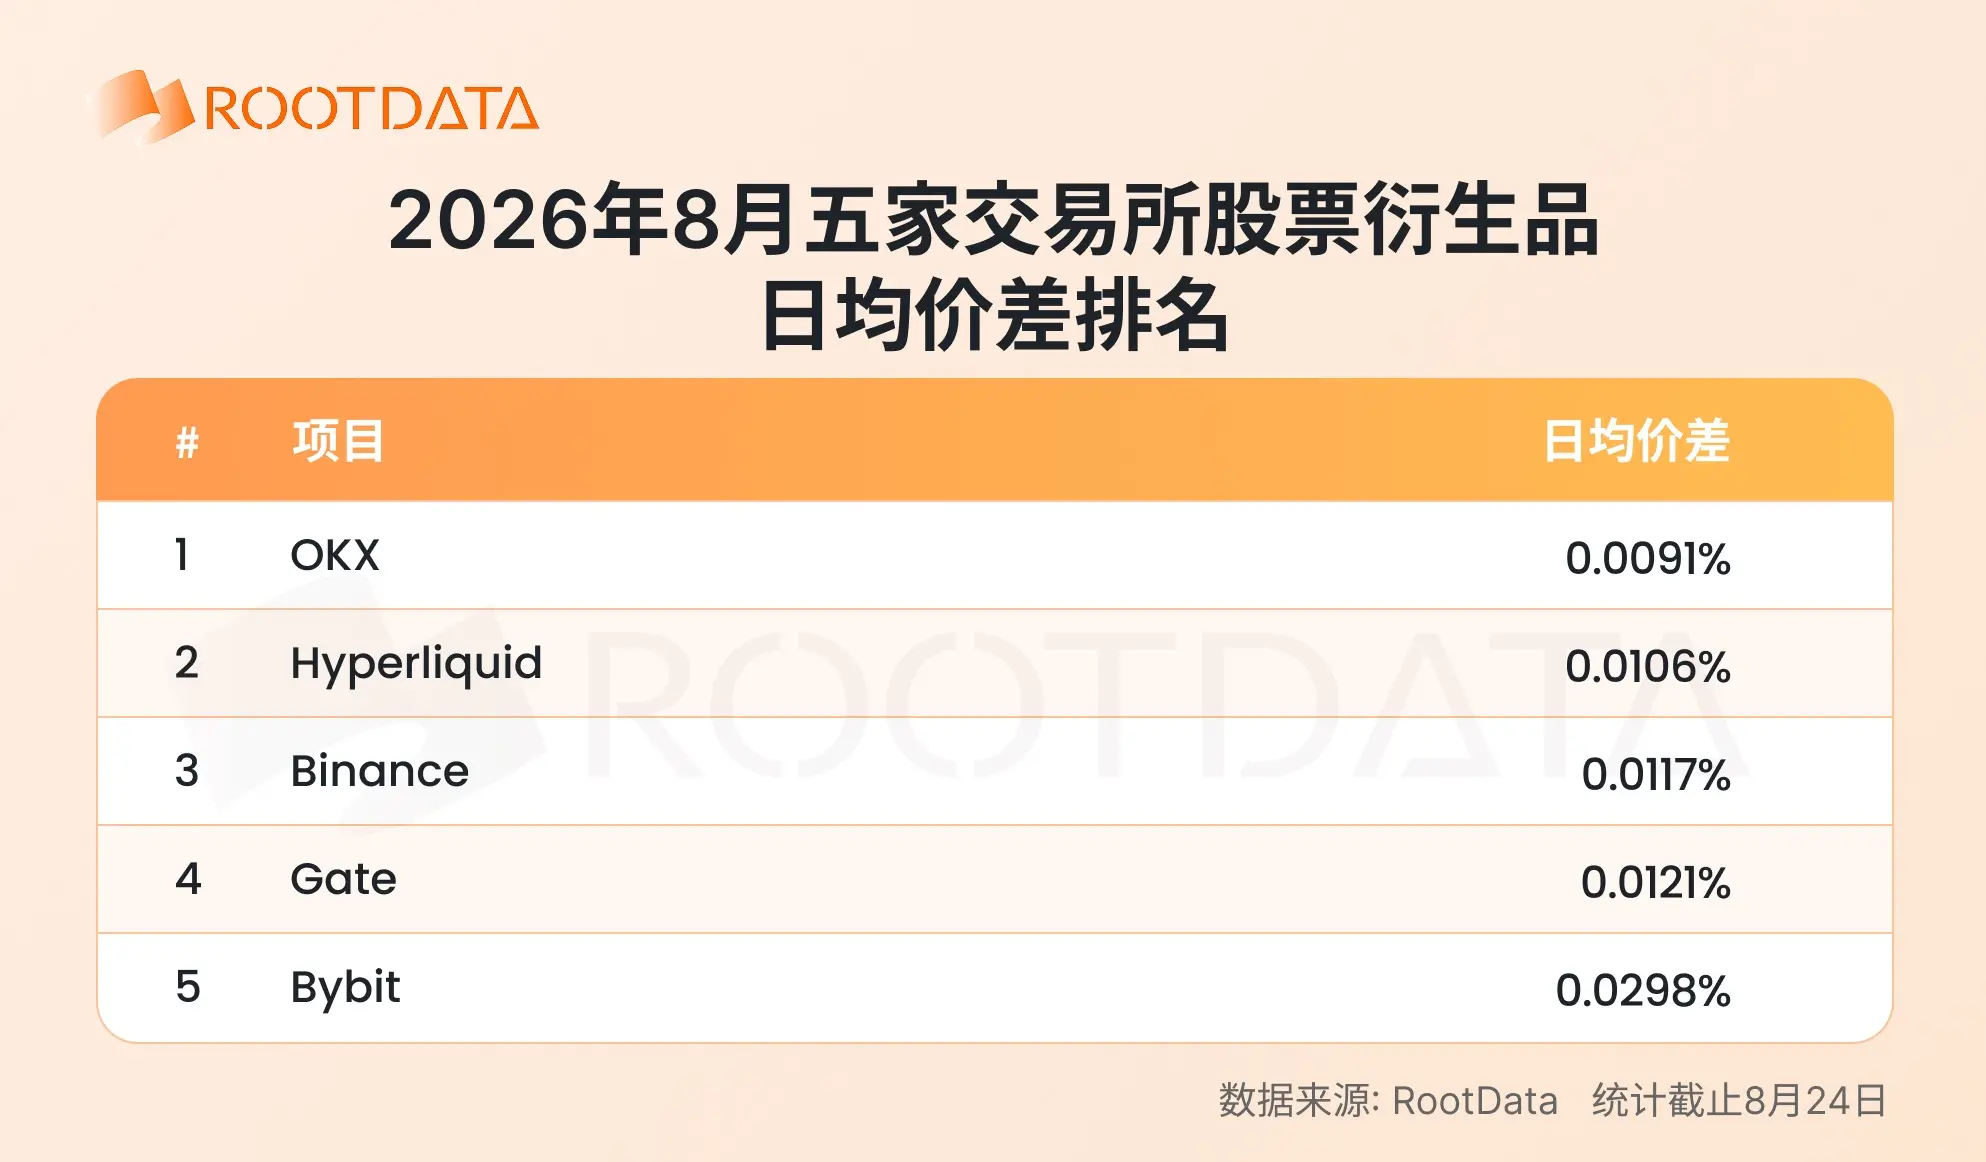
Trading costs are also an important factor affecting trading experience. OKX has the lowest weighted spread at 0.0091%, followed by Hyperliquid at 0.0106%, while Binance (0.0117%) and Gate (0.0121%) are almost at the same level, ranking third and fourth, respectively. Bybit trails with 0.0298%, but overall, the spreads of leading exchanges are relatively stable. Notably, Gate's spread has significantly decreased since August 18, maintaining a spread range of 0.0043% - 0.0086% for five consecutive days, the best in the market.
5. Variety matrix: Who is "distributing" and who is "penetrating"?
When trading costs are compressed to the extreme, the number of targets a platform can provide becomes the next competitive dimension. Snapshot data from August 24 shows that Gate ranks first with 366 stock derivative targets, followed by Bybit (206), Binance (170), OKX (156), and Hyperliquid (116). If we expand the view to CFDs, by Q2 2026, Gate has launched 663 trading assets in CFDs, with a single-week trading volume peak exceeding $150 billion, also ranking among the top in global crypto platforms.
However, the number of varieties is only one aspect of coverage capability; the other aspect is the actual share of popular assets. Taking four leading targets—SNDK, SK Hynix, MU, and SPCX—as examples, according to RootData's tokenized asset data on August 24, the competitive rankings across platforms show distinct differences.
Binance is the absolute center of flow and stock. It ranks first in 24-hour trading volume for all four targets and holds three first-place positions in OI. However, its lead is concentrated in "volume," with spreads and leverage advantages not being obvious; most target spreads are only in the second tier, and its depth advantage in storage chain stocks has even been surpassed.
Among the four targets, Gate has the lowest spreads across the board, with SNDK at 0.0007%, SK Hynix at 0.0009%, and offering the highest leverage of 75 times on three targets. More importantly, the main support depth for SK Hynix's ±2% liquidity depth is $2.45 million, which is 5.9 times that of Binance and 4 times that of Bybit; MU's depth of $6.5 million ranks first among the five, leading Hyperliquid by 19% and Binance by 51%.
Hyperliquid, on the other hand, has ample depth but lacks a significant advantage in spreads. SNDK's depth of $7.72 million ranks first, and MU's depth is second, with OI topping on MU, but spreads on SNDK and MU are noticeably wider.
6. Multi-dimensional radar: Horizontal comparison summary
From a six-dimensional ranking perspective, the current landscape of stock derivatives exchanges shows a clear differentiated distribution.
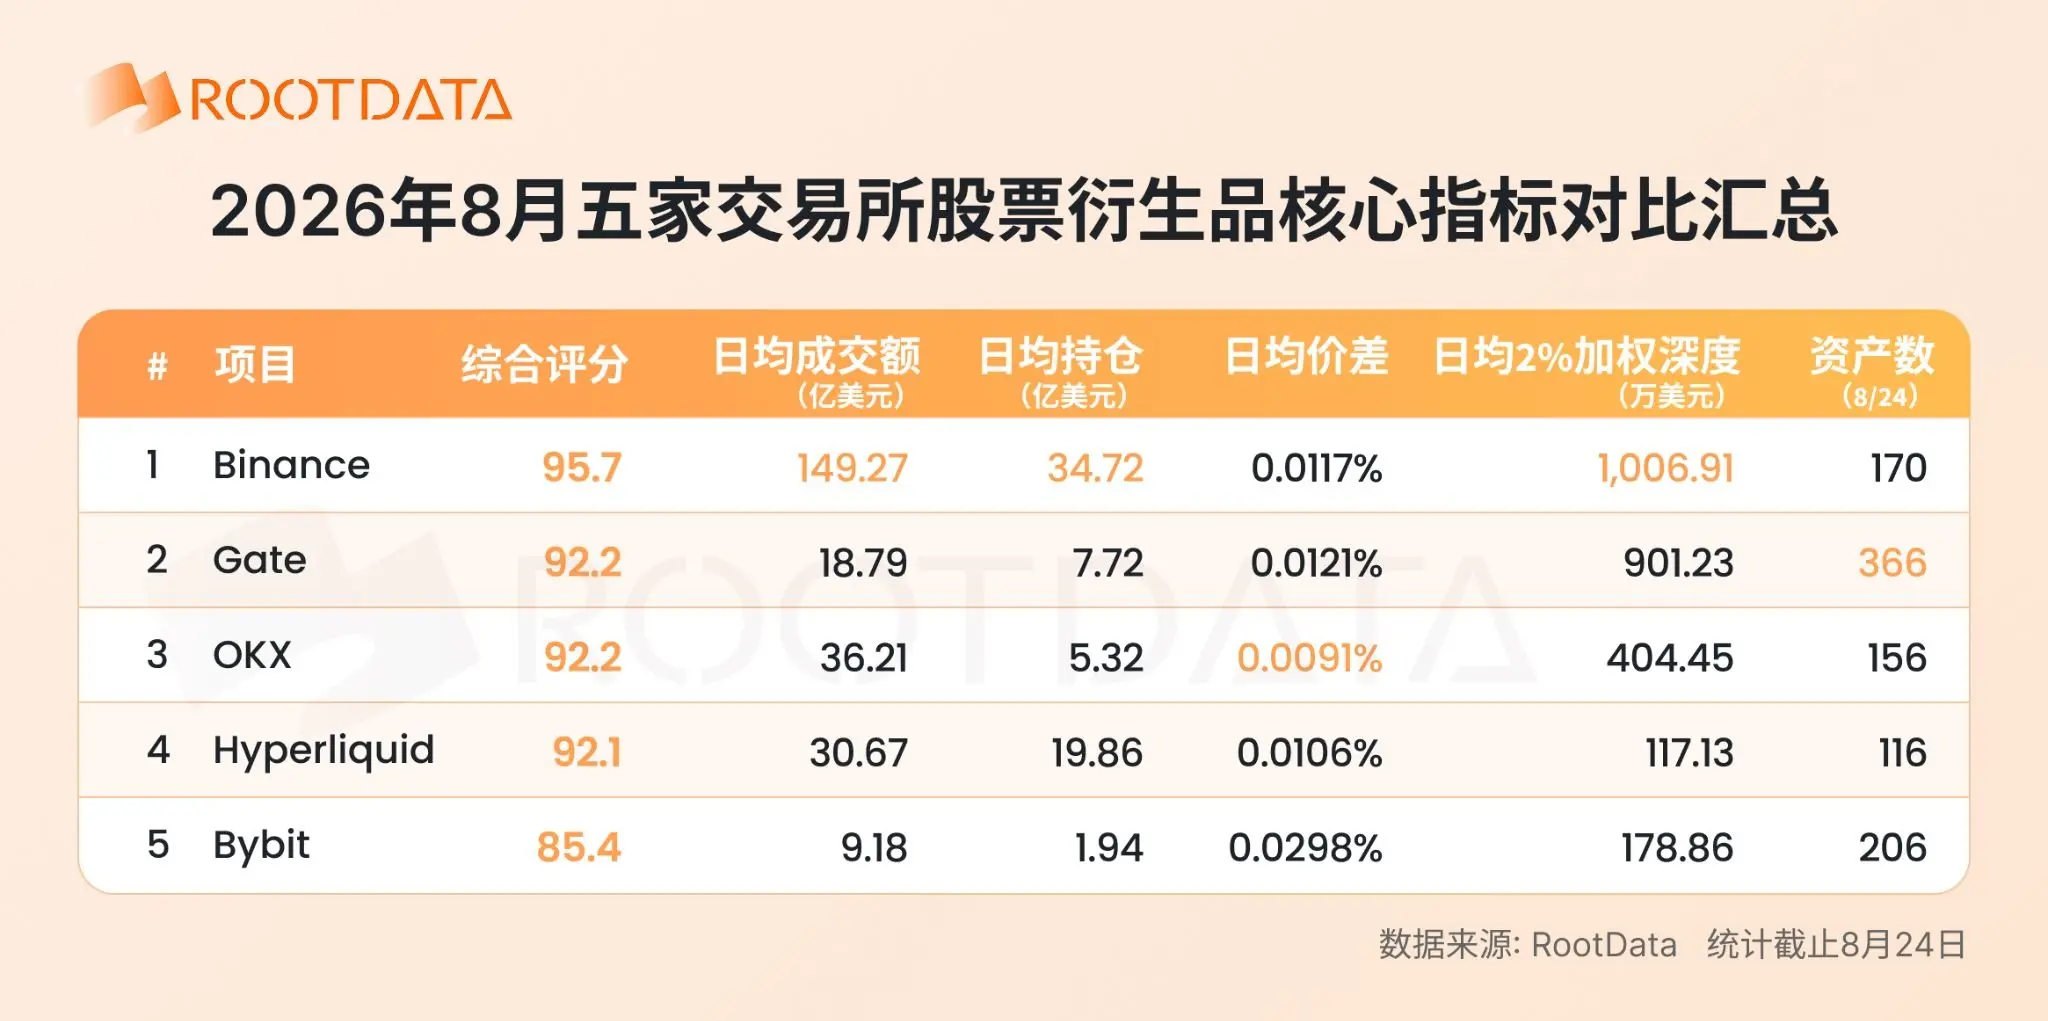
Binance ranks first in comprehensive scoring, average daily trading volume, average daily open interest, and average daily ±2% weighted depth, making it the main carrier of current stock derivatives liquidity, holding an irreplaceable central position among broad-based targets.
Gate ranks second in comprehensive scoring, second in average daily ±2% weighted depth, and first in asset quantity with 366, also showing the highest month-on-month growth rates in July and August among the five, demonstrating active performance in breadth of variety coverage and growth momentum.
OKX ranks second in comprehensive scoring, with the lowest average daily spread of 0.0091% among the five, performing outstandingly in terms of trading costs, attracting traders who value quote quality.
Hyperliquid ranks second in average daily open interest, also performing well in spread control, but its average daily depth is relatively behind, reflecting its platform characteristics of longer user holding periods and lower trading frequencies, overall presenting a "high accumulation, low turnover" style.
Bybit ranks second in asset quantity, while its other dimensions are in the fourth to fifth positions, showing a gap in overall volume compared to leading platforms, with its layout in the stock derivatives sub-track still in the expansion stage.
IV. Conclusion
In 2026, TradFi assets have rapidly grown from a marginal category to a core track with monthly trading volumes in the hundreds of billions, with the cumulative trading volume of TradFi assets on cryptocurrency exchanges reaching $1.3 trillion in the first half of the year, marking the accelerated dissolution of boundaries between crypto platforms and traditional financial markets.
The landscape of exchanges is also evolving simultaneously. Binance remains the absolute center of flow and stock, but its trading volume share has fallen from 78% at the beginning of the year to less than 60% in August, with the market transitioning from "unipolar concentration" to "multipolar diversion." OKX has rapidly gained volume through low trading costs, while Hyperliquid attracts long-term funds with high position accumulation, establishing barriers on both the cost and allocation sides. Gate is a variable worth continuous observation in this landscape; while its overall volume has a certain gap with Binance, its comprehensive operational level is relatively balanced, and its recent growth rate is in a relatively leading position. In some sub-assets, its liquidity depth and spreads have already shown a certain level of competitiveness.
Looking ahead to the second half of the year, the competitive logic of the TradFi track is shifting from who has larger flow to who can provide better quotes and deeper order books on core assets across multiple comprehensive experience dimensions. Platforms that complete positioning in advance are more likely to capture the next round of incremental growth.
 Risk warning