Coinbase Q4 Market Outlook: Prices Have Bottomed Out, Still Present Upside Opportunities Amid Interest Rate Hikes
 Core Viewpoint

 Interest rates have risen, and U.S. Treasury yields have reached a new high since 2002, yet Bitcoin has increased by 43%. Glassnode and Coinbase believe the market has transitioned from bottoming out to a preliminary recovery.
Author: Glassnode, Coinbase Institutional
Compiled by: Jiahua, ChainCatcher
Outlook: Recovery Has Arrived, Maintaining a Positive View for Q4
We hold a positive outlook for the cryptocurrency market in the fourth quarter of 2026. Despite the Federal Reserve tightening its policy again, Bitcoin still rose 43% in the third quarter, reaching $83,600. This indicates that the trend towards accumulation we described last quarter has developed into an initial recovery.
The larger variable lies in the policy shift towards tightening. In September, the Federal Reserve raised interest rates by 25 basis points, increasing rates to 3.75% to 4.00%, marking the first rate hike since July 2023, even though core CPI has dropped to 2.4%. The yield on the 10-year U.S. Treasury bond rose 85 basis points this quarter, reaching 5.29%, a new high since 2002. The market currently expects further rate hikes of about 64 basis points over the next six months. Even so, Bitcoin's performance still outperformed gold and several stock markets, indicating that new demand is driven by various factors, not just the liquidity factors that dominated the first half of the year.
On-chain conditions have significantly improved. The entity-adjusted NUPL rose from 0.11 to 0.38, bringing Bitcoin back into the "optimistic/anxious" range. The proportion of supply in profit increased from 46% to 71%, re-establishing itself at the lower end of the statistical range. The supply that has not moved for over a year has increased by about 340,000 BTC, indicating that long-term holders have largely continued to hold during this rally. The MVRV is at 1.56, with a realized price of about $53,600, indicating that valuations have returned to normal but are not yet close to the levels seen at the peaks of previous cycles.
Caution is still necessary. This rally has led to more tokens being re-circulated, with the supply that has moved in the past three months increasing by 16%, reaching 2.8 million BTC. Long-term holders turned to slight net selling in August. About 1.7 million BTC were last traded at prices between $89,600 and $93,700, forming a dense supply zone just above the current price.
The long-term factors supporting the market are still expanding. This quarter, ETH outperformed Bitcoin by about 20%, with the total locked value (TVL) in Ethereum DeFi rising from $37 billion to $53 billion, and net inflows into U.S. Bitcoin spot ETFs reaching $7 billion. These changes indicate that the foundation of institutional and on-chain demand is expanding, although short-term trends remain more susceptible to real yields and positioning rather than long-term adoption trends.
To help investors navigate this environment, we are pleased to provide the latest market data and on-chain analysis to help investors better understand the trends currently shaping the market and how these trends may affect the crypto economy in the future. We hope this article can assist you in participating in the crypto market, and we welcome your feedback and questions.
Cryptocurrency Market View
Our Overall Market View
We are optimistic about Q4 2026.
We hold a positive outlook for the cryptocurrency market in the fourth quarter of 2026, as Bitcoin has transitioned from a bottoming phase to an initial recovery even with tightening policies.
- Bitcoin rose 43% in Q3 2026, outperforming gold and stocks, despite the Federal Reserve raising interest rates and the 10-year U.S. Treasury yield rising to 5.29%.
- U.S. Bitcoin spot ETFs saw net inflows of $7 billion in Q3 2026, reversing the outflows from the first half of the year and pushing assets under management to $127 billion.
- Although short-term signals suggest caution is warranted, and there is an upper supply zone around $90,000 to $94,000, we still view a pullback to the 200-day moving average as an accumulation opportunity.
What Factors Could Change Our Judgment
What would make us more optimistic:
If the Federal Reserve pauses rate hikes after the September increase, and the three-month annualized increase in core PCE remains at 2.1%, it would help alleviate the pressure from real yields. A clear breakout of Bitcoin above the $90,000 to $94,000 supply zone, continued inflows into ETFs, and tokens continuing to flow out of exchanges would enhance our confidence in a sustained upward trend.
What would make us more concerned:
If the 10-year U.S. Treasury yield rises further towards 5.5%, or if oil prices remain around $90, keeping overall inflation high, the market may begin to anticipate more rate hikes, tightening financial conditions. If prices are blocked in the upper supply zone and subsequently fall below the 200-day moving average (currently around $71,000), while ETFs continue to see outflows, it would indicate that the market recovery needs more time.
Market Overview
Total Market Capitalization of Cryptocurrency
In Q3 2026, the total market capitalization of the cryptocurrency market (excluding stablecoins) rose by about 48%, reaching $2.55 trillion. More than half of the increase occurred in the week of August 17, when Bitcoin rose by 24%. The supply of stablecoins remained relatively unchanged at $311 billion, still below the record of $321 billion set in May. As a result, the market capitalization share of stablecoins dropped from about 15% to 11%. This reflects the rise in cryptocurrency asset prices rather than a contraction in stablecoin supply.
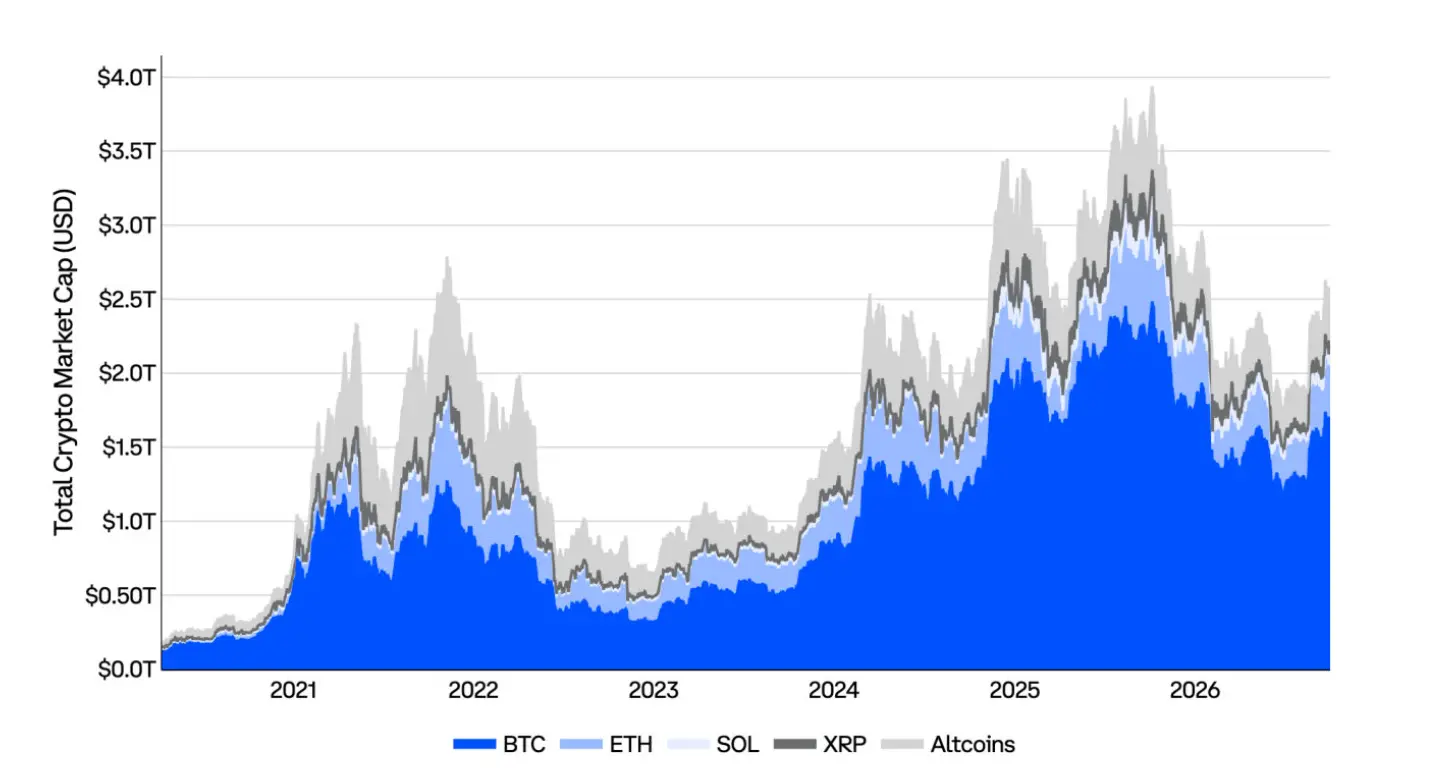
Figure: Total Market Capitalization of Cryptocurrency
Bitcoin's Price Performance Since Cycle Low
Bitcoin has gone through four complete cycles, each containing bull and bear markets (the cycle from inception to 2011 is not shown in the chart). The current cycle began in 2022, with the price performance in the first two years closely resembling that of the 2015 to 2018 cycle, but diverging in the first quarter of 2025, as some market participants, mainly long-term holders, reduced their risk exposure.
The current cycle has lasted over 46 months, with the peak seemingly forming in October 2025, when the price was 7.9 times the cycle low. In Q3 2026, Bitcoin rebounded from 3.8 times the cycle low to 5.4 times, indicating that the low after the peak may have already occurred, but it remains unclear whether these historical patterns still apply.
Past performance does not guarantee future results.
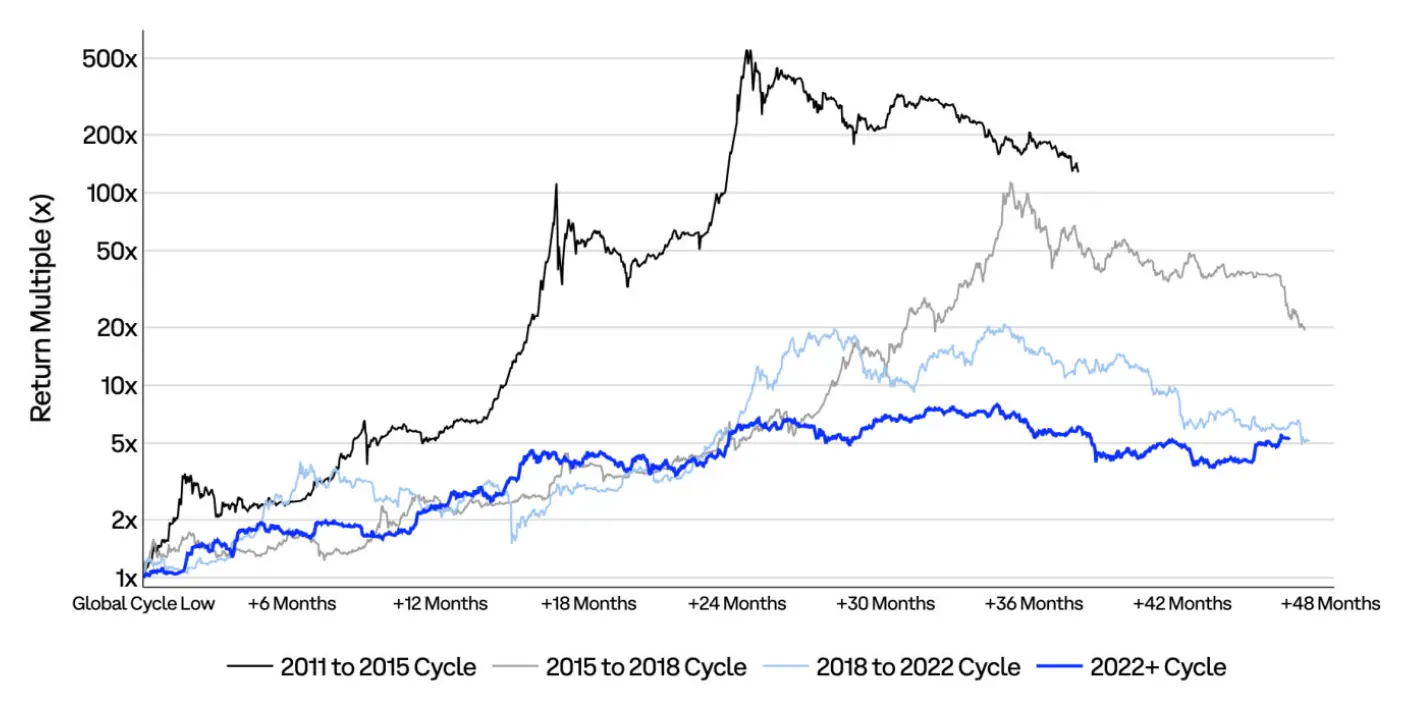
Figure: Comparison of Bitcoin's price multiples and durations since cycle lows across different cycles.
Ethereum's Price Performance Since Cycle Low
Ethereum has gone through at least two complete cycles, each containing bull and bear markets. The current market cycle officially began in 2022, with the first two years' trends resembling those of the 2018 to 2022 cycle, but diverging significantly thereafter.
The current cycle has lasted over 46 months. In Q3 2026, Ethereum rebounded from 1.4 times the November 2022 low to 2.4 times, outperforming Bitcoin by about 20%. However, the post-rebound ETH is still far below the cycle peak of 4.4 times and has clearly deviated from the trend of the 2018 to 2022 cycle, which had reached 17.3 times the low at the same stage. This divergence aligns with the gradual maturation of market structure: returns increasingly depend on actual use cases, regulatory clarity, and real adoption, rather than the speculative surges common in earlier cycles.
Past performance does not guarantee future results.
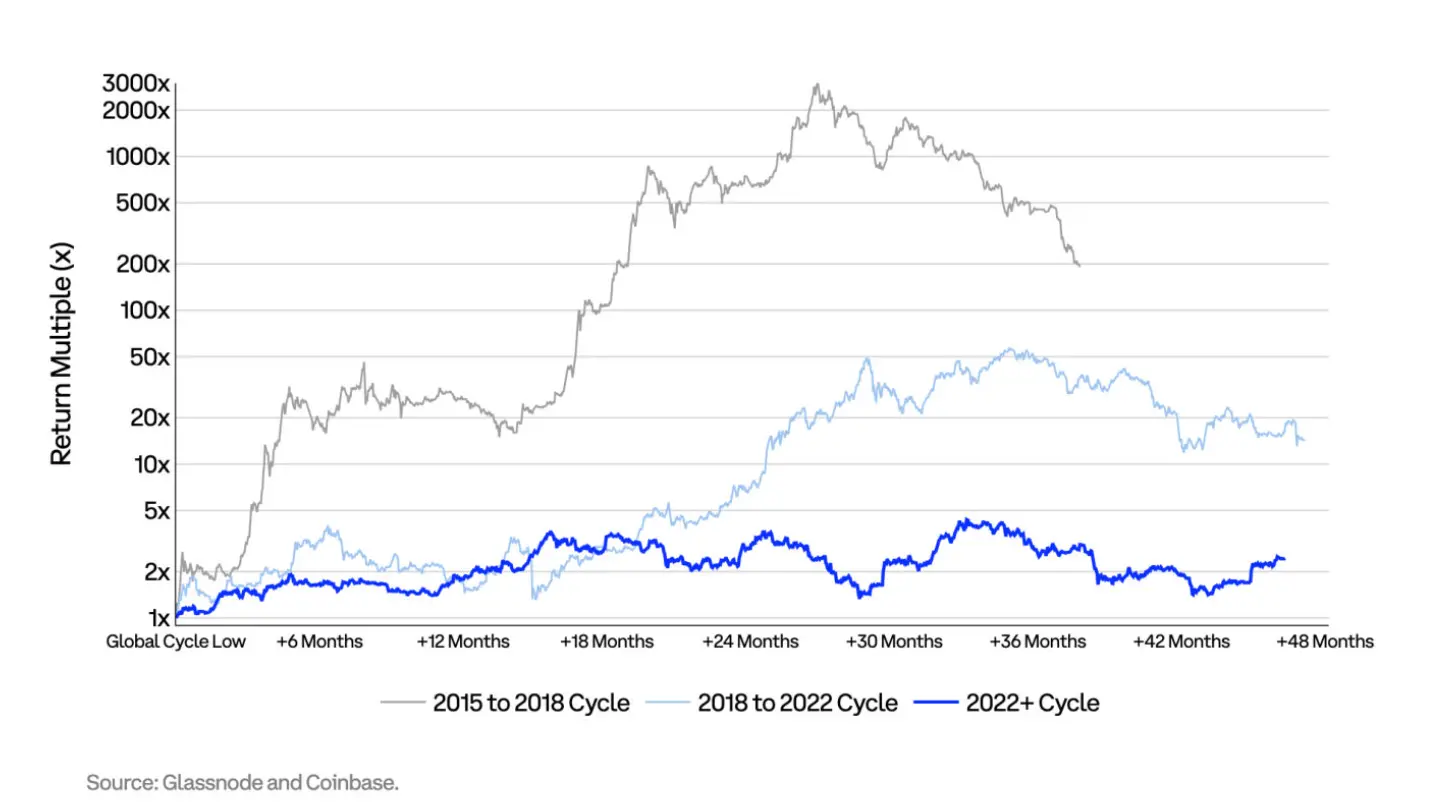
Figure: Comparison of Ethereum's price multiples since cycle lows in the cycles from 2015 to 2018, 2018 to 2022, and starting in 2022.
Correlation Matrix
Outside of cryptocurrency assets, Bitcoin's performance in Q3 2026 was most closely aligned with precious metals. Its daily return correlation coefficients with gold and silver were both 0.61, while the correlation coefficient with the U.S. Dollar Index was -0.43. Bitcoin's correlation with U.S. stocks was relatively low: the correlation coefficient with the S&P 500 Index was 0.30, and with the Nasdaq Index was 0.29; the correlation coefficients with 2-year and 10-year U.S. Treasury yields were negative. These relationships indicate that this rally is more driven by demand for alternative assets to the dollar rather than a general resurgence in risk appetite. This is also consistent with Bitcoin's strong performance relative to U.S. Treasuries when Treasury yields rise.
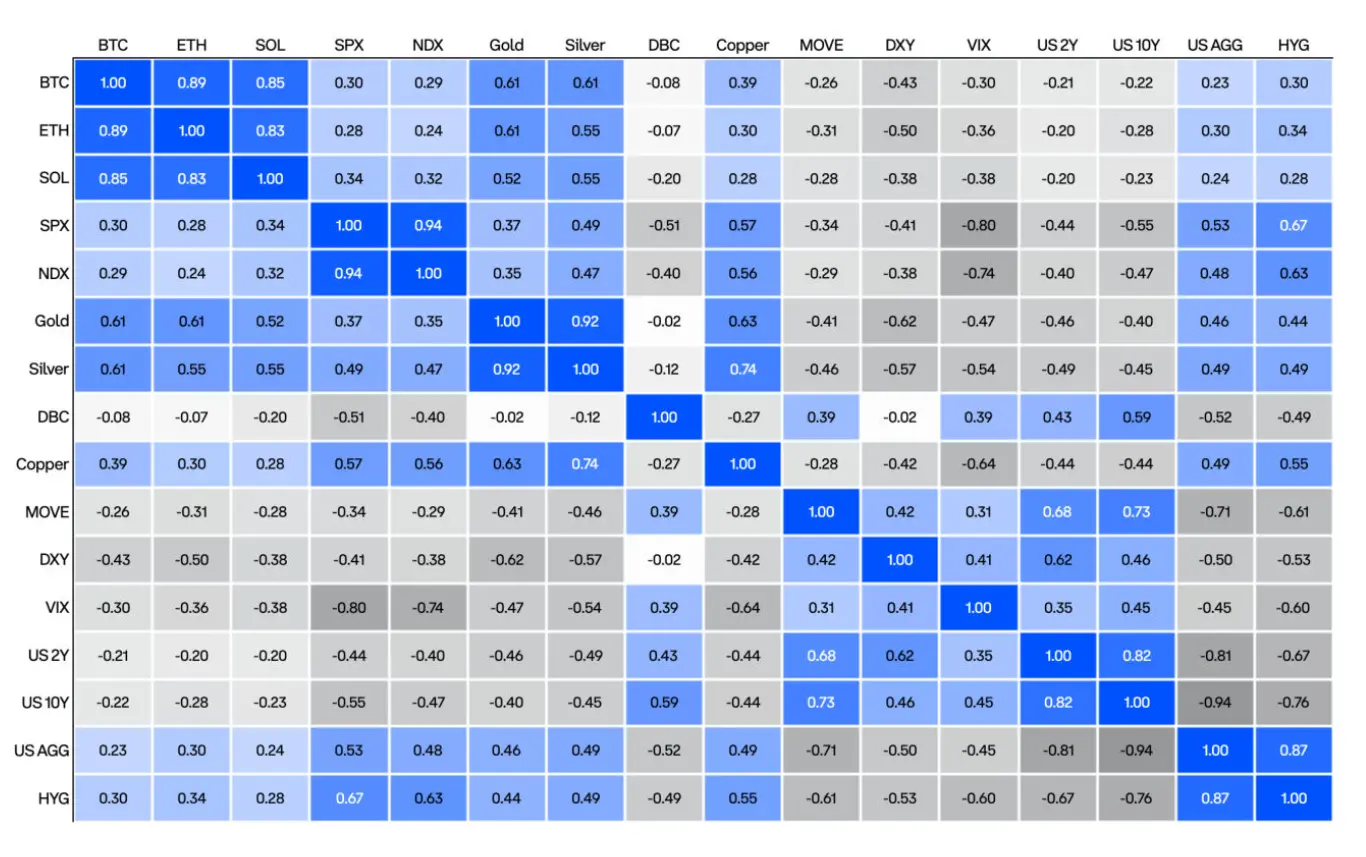
Figure: Correlation matrix of returns among cryptocurrency assets, stocks, precious metals, the U.S. Dollar, and Treasury yields.
Volatility and Rolling Correlation
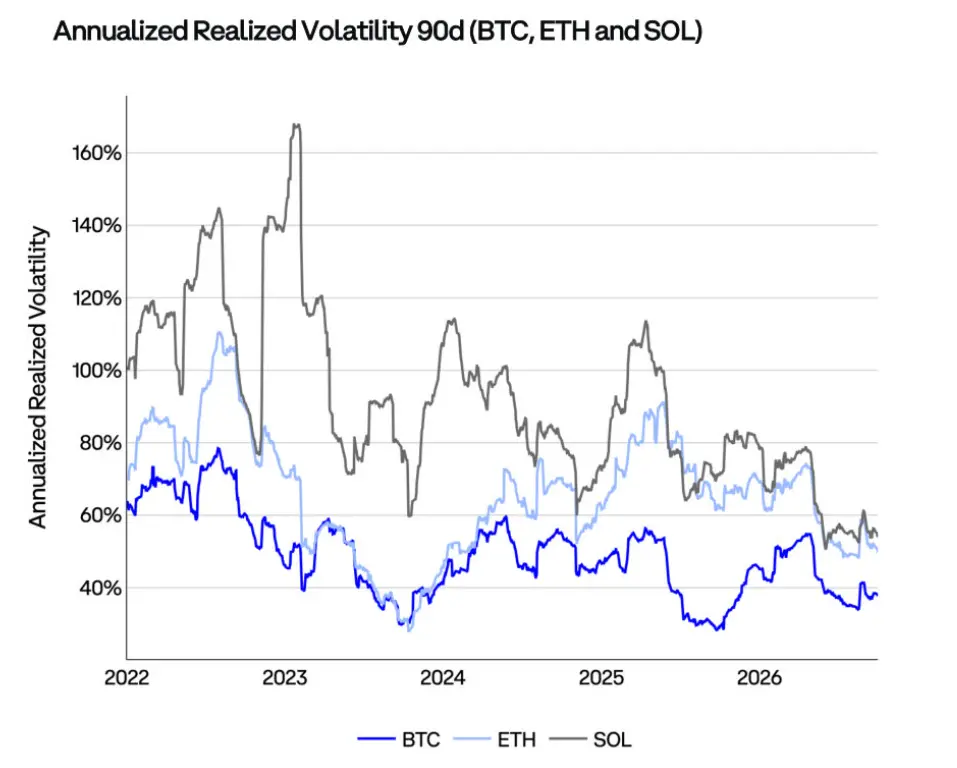
Figure: 90-day annualized realized volatility of BTC, ETH, and SOL, calculated based on a three-month rolling window.
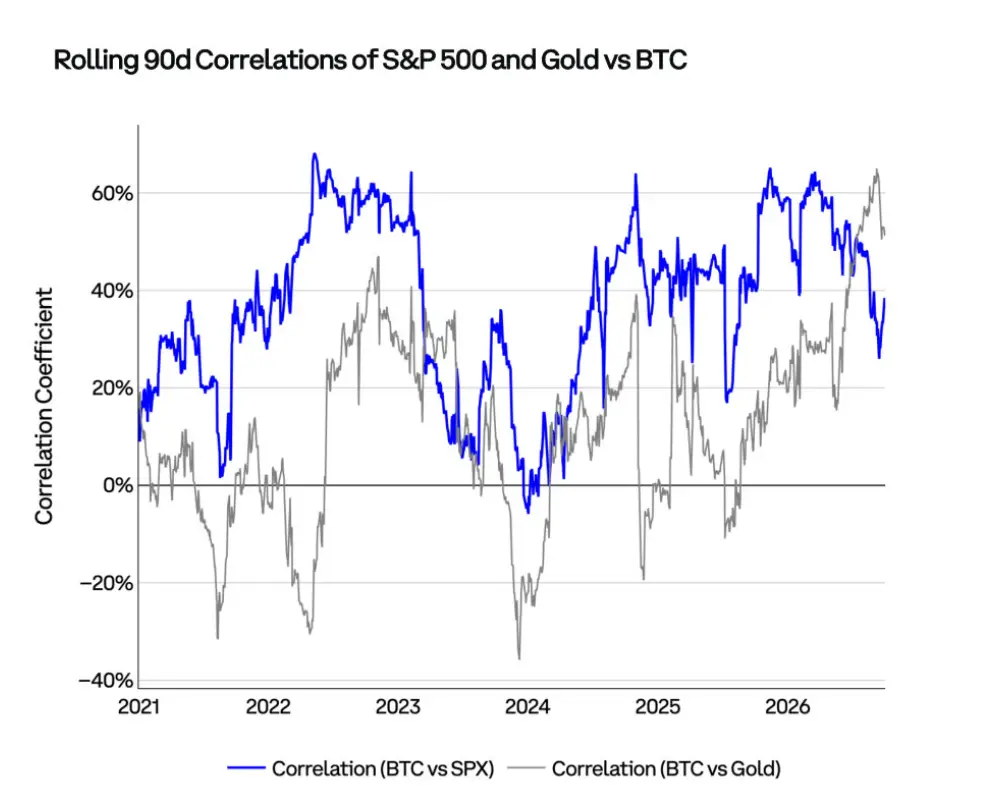
Figure: 90-day rolling correlation coefficients of BTC with the S&P 500 Index and gold, calculated based on a three-month rolling window.
Spot ETF Fund Flows
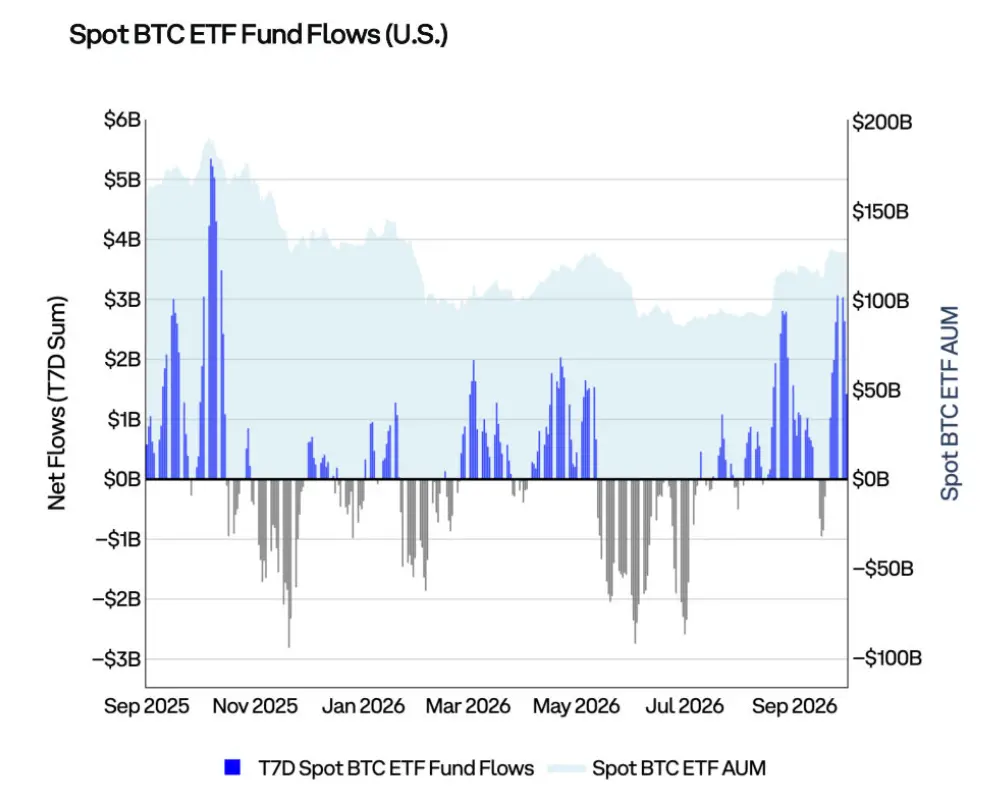
Figure: 7-day cumulative net inflows and assets under management (AUM) of U.S. Bitcoin spot ETFs.
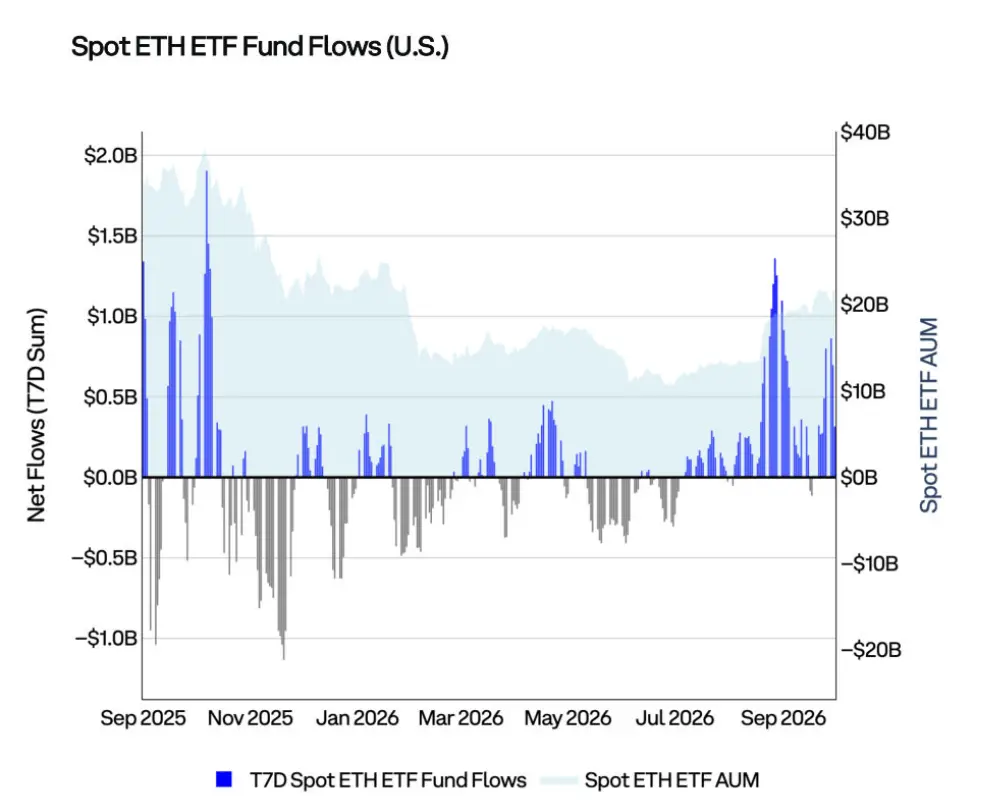
Figure: 7-day cumulative net inflows and assets under management (AUM) of U.S. Ethereum spot ETFs.
Stablecoins
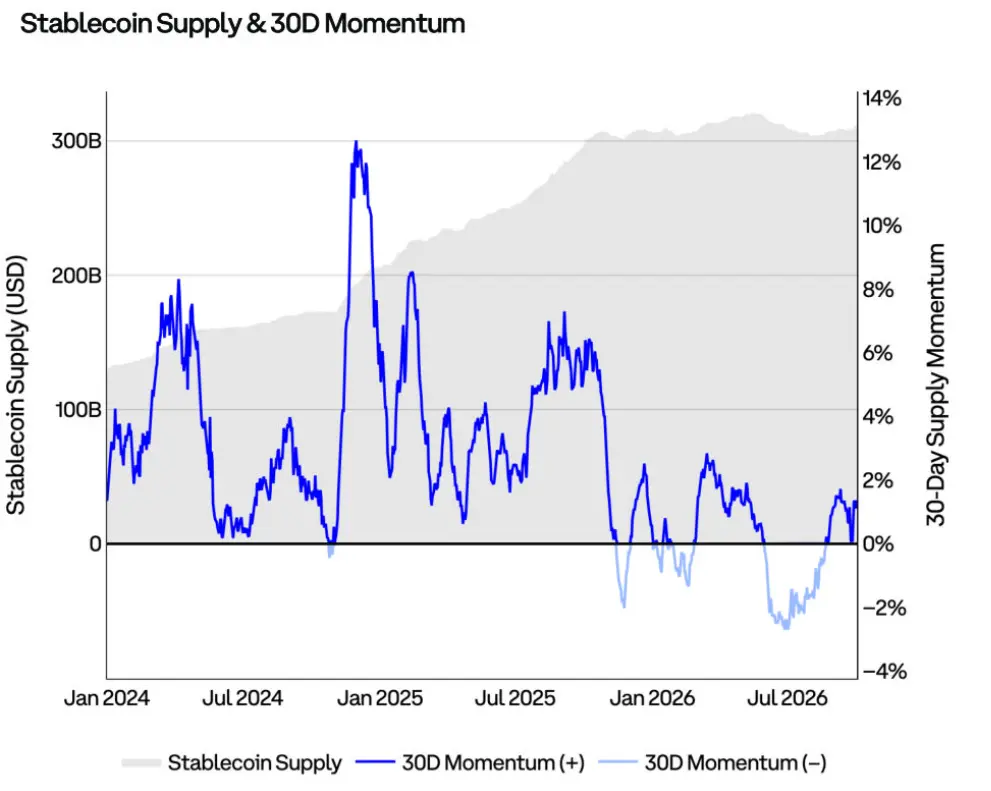
Figure: Total supply of stablecoins and their 30-day change rate, distinguishing between positive and negative growth.
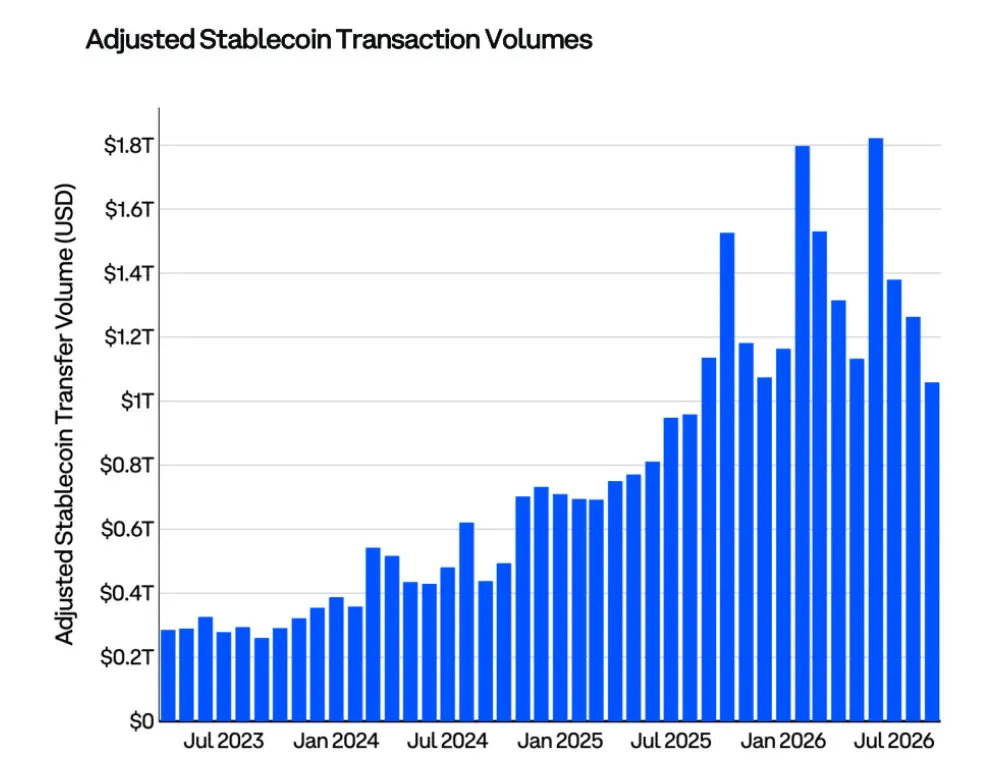
Figure: Adjusted stablecoin transfer transaction volume.
Bitcoin
Bitcoin (BTC) is the world's first widely adopted cryptocurrency. It is important to distinguish that the token "bitcoin" is not the same as the "Bitcoin" network that facilitates its transactions. This network enables secure and smooth peer-to-peer transactions over the internet through blockchain technology. The Bitcoin blockchain is a public ledger that contains the historical record of all Bitcoin transactions. BTC is decentralized: two people anywhere in the world can send each other Bitcoin without going through banks, governments, or other institutions.
- Developer: Bitcoin was created by Satoshi Nakamoto. Satoshi Nakamoto is a pseudonym used by a person or team that outlined this technology in a white paper in 2008.
- Reference Price: Bitcoin Reference Rate (BRR), CME CF Benchmark Reference Rate
- Bloomberg Code: XBT Currency
- Circulating Supply: 20.09 million coins
- Circulating Supply Ratio: 95.7%
- Inflation Rate: 0.8%
Bitcoin: Key Points
- In the third quarter of 2026, the size of Bitcoin derivatives open interest rose by 36% to approximately $80 billion, primarily driven by options. Meanwhile, the annualized basis of CME futures widened from about 4% to 6%. Open interest rebounded with rising prices but remains below the peak of about $114 billion in October 2025.
- The net unrealized profit and loss (NUPL) adjusted for entities shows that BTC market sentiment gradually recovered in the third quarter of 2026. This indicator rose from 0.11 to 0.38, moving from the "hope/fear" range back into the "optimism/anxiety" range. However, it still remains significantly below the threshold of 0.48 in the "belief/denial" range, indicating that sentiment has normalized but is not yet overheated.
- Although Bitcoin rose by 43% in the third quarter of 2026, approximately 340,000 BTC that had not moved for over a year still increased. Meanwhile, tokens that had moved in the past three months increased by 16% after hitting the lowest level since the end of 2023 in July. This combination suggests that long-term holders largely continued to hold during the rise, while newer market participants began to return.
BTC Indicator Map
This map filters 533 sets of on-chain and macro indicator sequences, examining their relationship with Bitcoin's subsequent 30-day returns. Only indicators that meet the following conditions will be displayed: passing significance tests after multiple comparison corrections; the current value is sufficiently distant from its median for testing; and the signal direction is consistent with its historical relationship. The size of the squares indicates the reliability of this relationship, while the color and numbers indicate the implied difference in future 30-day returns relative to typical levels, measured in percentage points.
As of September 30, 41 out of the 533 sets of indicators passed the above tests, with 27 sets pointing to future 30-day returns below typical levels. Overall, macro indicators are slightly positive: Bitcoin's strength relative to small-cap stocks, long-term U.S. Treasury bonds, and gold is partially offset by its relative performance being far from 52-week highs against the dollar and emerging markets. On-chain indicators are more clearly weak, with 8 out of 9 pointing to returns potentially below typical levels after the rise in the third quarter.
This combination of signals suggests a short-term consolidation rather than a trend reversal. Among on-chain indicators, the largest drag comes from the proportion of profit supply, the ratio of open interest to market capitalization, and on-chain trading volume on up days being weaker than on down days.
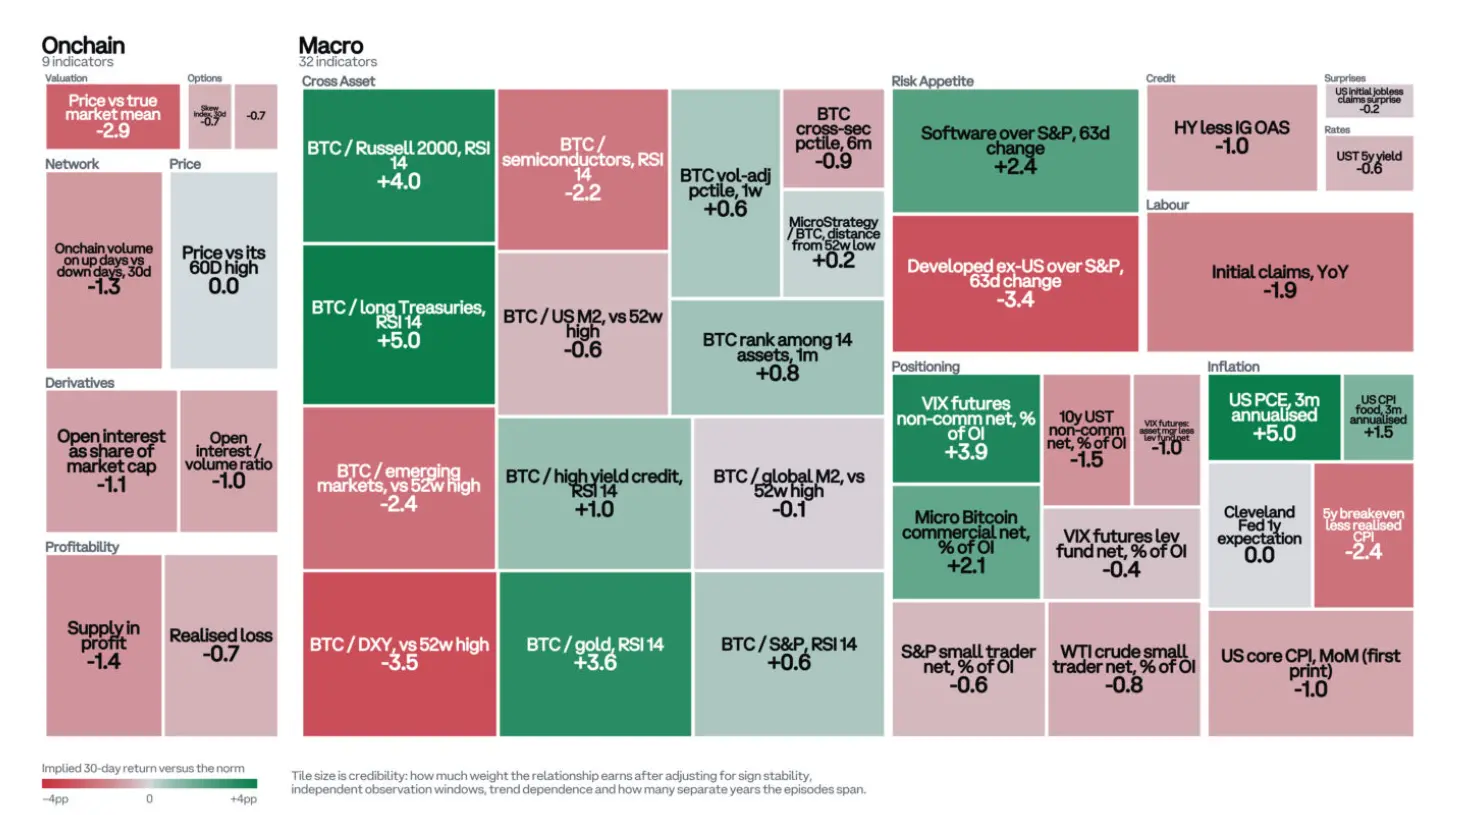
Figure: BTC Indicator Map, divided into 9 sets of on-chain indicators and 32 sets of macro indicators, with green indicating expected 30-day returns above typical levels and red indicating below typical levels.
BTC Support and Resistance Levels
This heatmap marks support and resistance levels based on confirmed price turning points in 4-hour candlesticks. The trading volume at each turning point is assigned to a narrower price range, given higher weight before the price retests that position and gradually decays over time. Therefore, the darker the color of the range, the more important the price level in the market. Blue indicates support below the current price, while gray indicates resistance above the current price.
At the end of the third quarter of 2026, the price of Bitcoin was approximately $83,600. The recent resistance level is in the range of $87,000 to $87,800, which limits the highs of September; a slightly higher range of about $90,000 to $94,000 has denser cost supply. The strongest support area below is between $74,500 and $75,200, just above the cost basis of short-term holders at $73,500; the 200-day moving average around $71,200 provides a second layer of support.
This distribution indicates that if the price falls back to just above $70,000, it will encounter multiple overlapping supports. This aligns with our judgment of viewing this area as a buying opportunity. A deeper support level remains around $58,000, where this quarter's low is located.
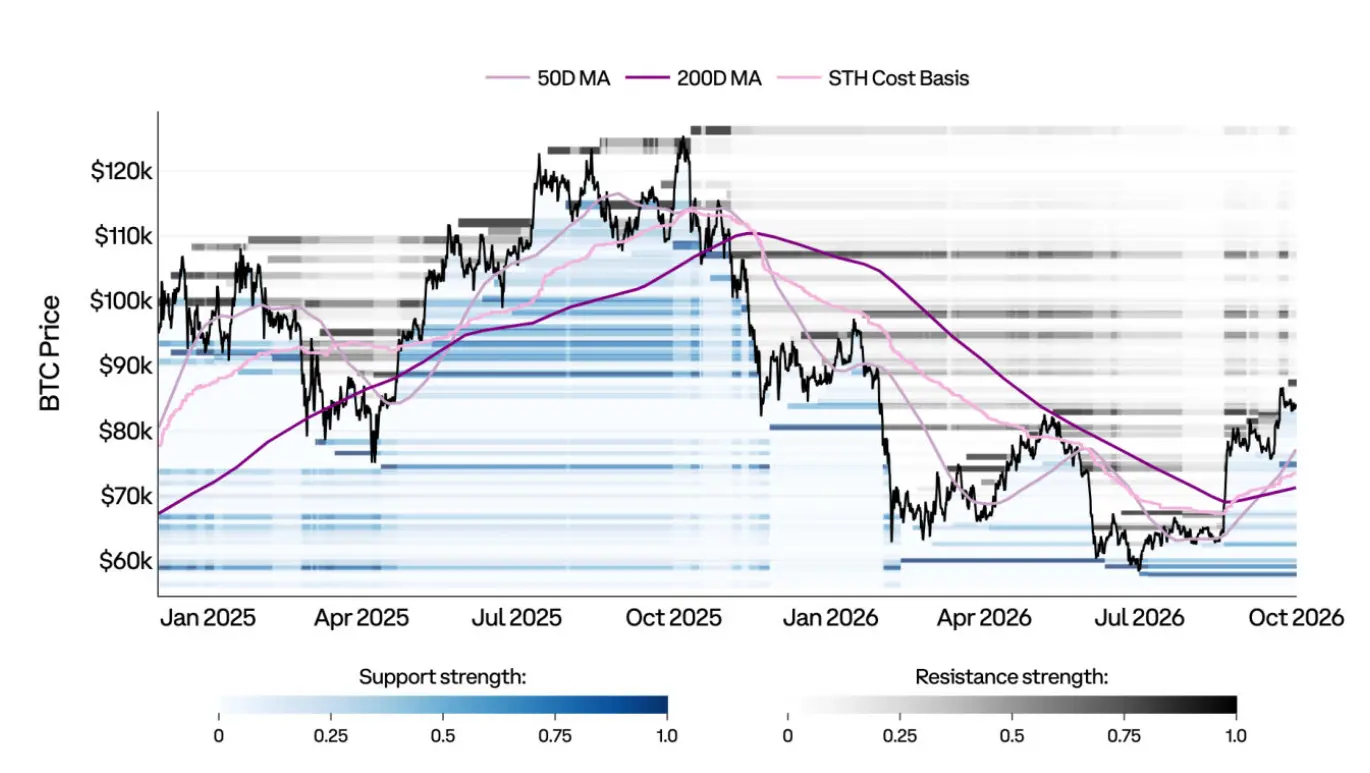
Figure: BTC Support and Resistance Heatmap, overlaid with the 50-day moving average, 200-day moving average, and short-term holder cost.
BTC Net Unrealized Profit and Loss (NUPL) Adjusted for Entities
Net unrealized profit and loss (NUPL) is the difference between relative unrealized profits and relative unrealized losses. The ranges in the figure reflect investor sentiment from different perspectives. Due to the unpredictability of the market, each stage is described using two opposite terms. These stages follow traditional market cycles: when the market recovers from a deep bear market, it often goes through "surrender → hope → optimism → belief → euphoria"; while entering a bear market after hitting historical highs, it may go through "greed → denial → anxiety → fear → surrender."
NUPL adjusted for entities is an improved version of NUPL that excludes transactions between different addresses of the same entity, known as "internal transactions." Therefore, the adjusted NUPL only accounts for real economic activity, providing better market signals compared to the unadjusted, UTXO-based version.
As prices rose, investor sentiment gradually recovered in the third quarter of 2026. NUPL increased from 0.11 to 0.38, moving from the "hope/fear" range back to the "optimism/anxiety" range, but still significantly below the threshold of "belief/denial."
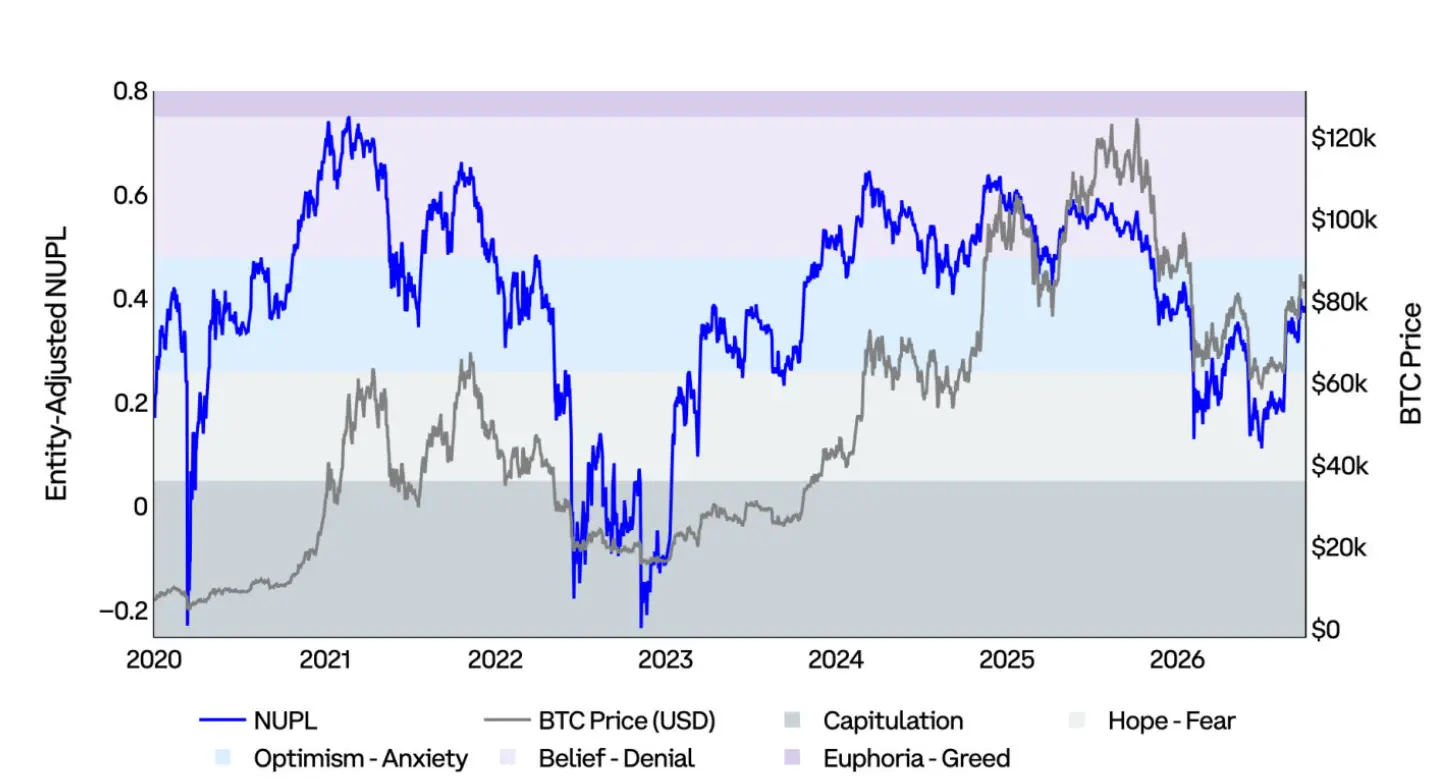
Figure: Entity-adjusted BTC Net Unrealized Profit and Loss and BTC price, indicating different sentiment ranges.
BTC Realized Price and MVRV
Realized price (or "on-chain cost basis") is valued at the price on the day of the last on-chain transaction for each Bitcoin, calculating the average price of all Bitcoin supply.
The MVRV ratio compares market value (spot price) with realized value (realized price) to measure the multiple of investors' unrealized profit and loss:
- MVRV of 2.0: Price is twice the average cost (average holder's return is 2 times).
- MVRV of 1.0: Price equals average cost (average holder is at breakeven).
- MVRV of 0.85: Price is 15% lower than average cost (average holder is down 15%).
Extreme values of MVRV help identify when the market is overheated or undervalued, as well as when investors' profit levels significantly deviate from average levels.
In the third quarter of 2026, as prices recovered, MVRV rose from 1.10 to 1.56, but still below its median of 1.76 since 2020.
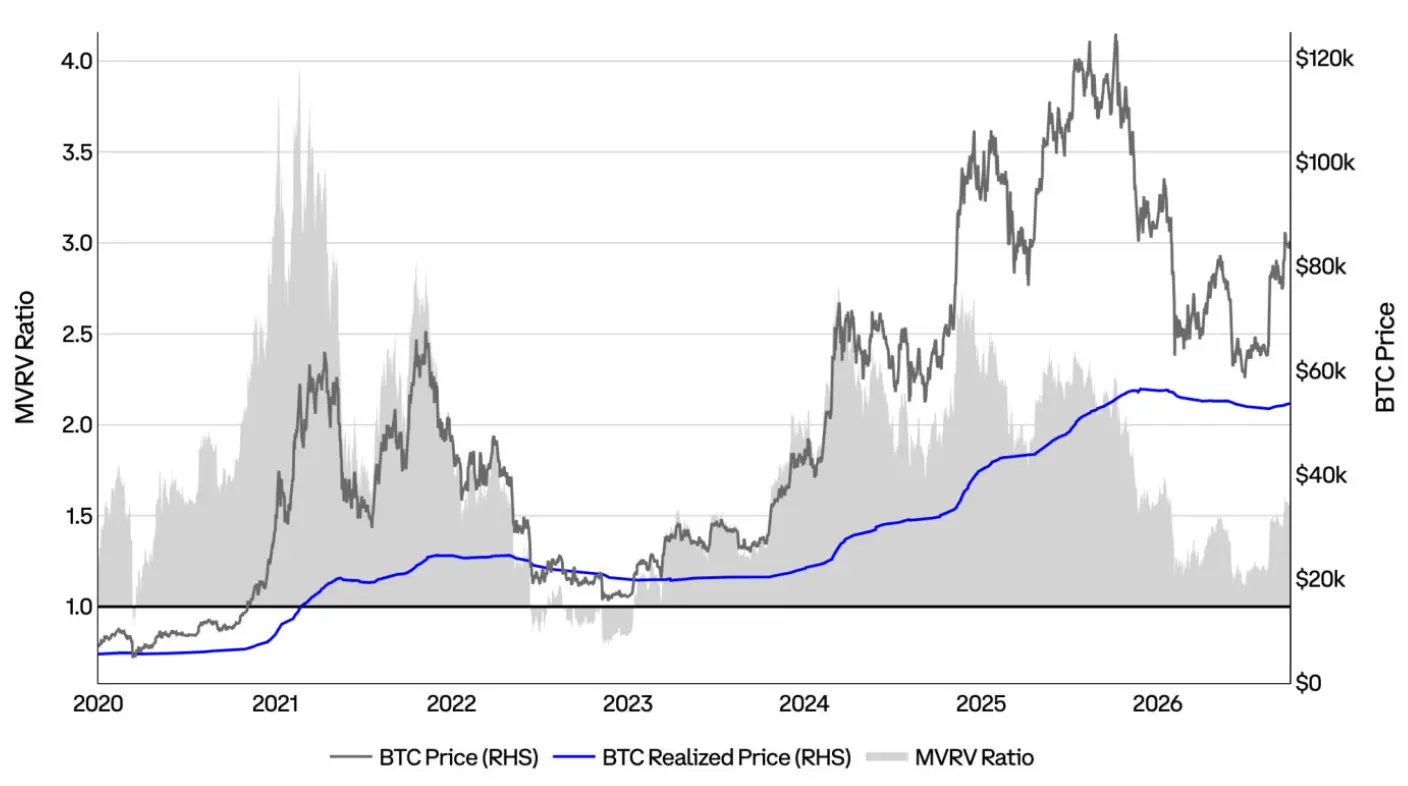
Figure: BTC spot price, realized price, and MVRV ratio.
BTC Profit and Loss Status of Supply
This figure shows the proportion of BTC in profit relative to the total supply, with statistical boundaries set at positive and negative 1 standard deviation. These represent important warning zones and accumulation zones. This indicator helps understand the holding status of investors and assess during what periods the majority of the supply is in profit or loss.
In the third quarter of 2026, this indicator rose from 46% to 71%, re-establishing itself above the negative 1 standard deviation boundary, leaving the historical accumulation zone but still significantly below the warning line of 91%.
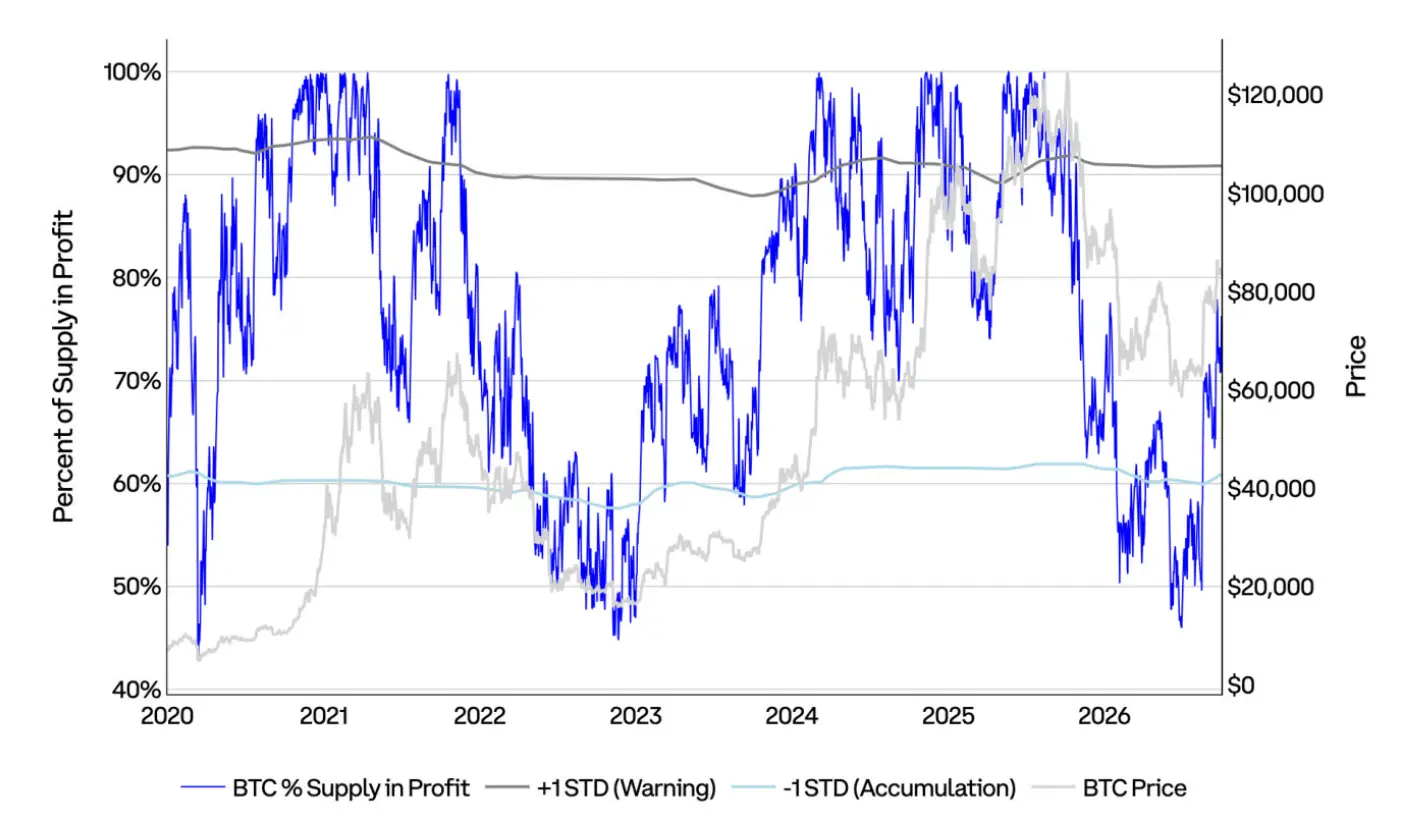
Figure: Proportion of BTC in profit, positive 1 standard deviation warning line, negative 1 standard deviation accumulation line, and BTC price.
BTC Dormant Supply vs. Active Supply
This figure compares the circulating supply of BTC that has not moved for at least a year with the circulating supply of BTC that has been active in a short period (less than three months).
The number of BTC that last moved in the past three months increased by 16% in the third quarter of 2026 after hitting the lowest level since the end of 2023 in July. This rise has brought some supply back into circulation. Meanwhile, the supply that has not moved for over a year still increased by approximately 340,000 BTC, indicating that long-term holders largely continued to hold during the rise.
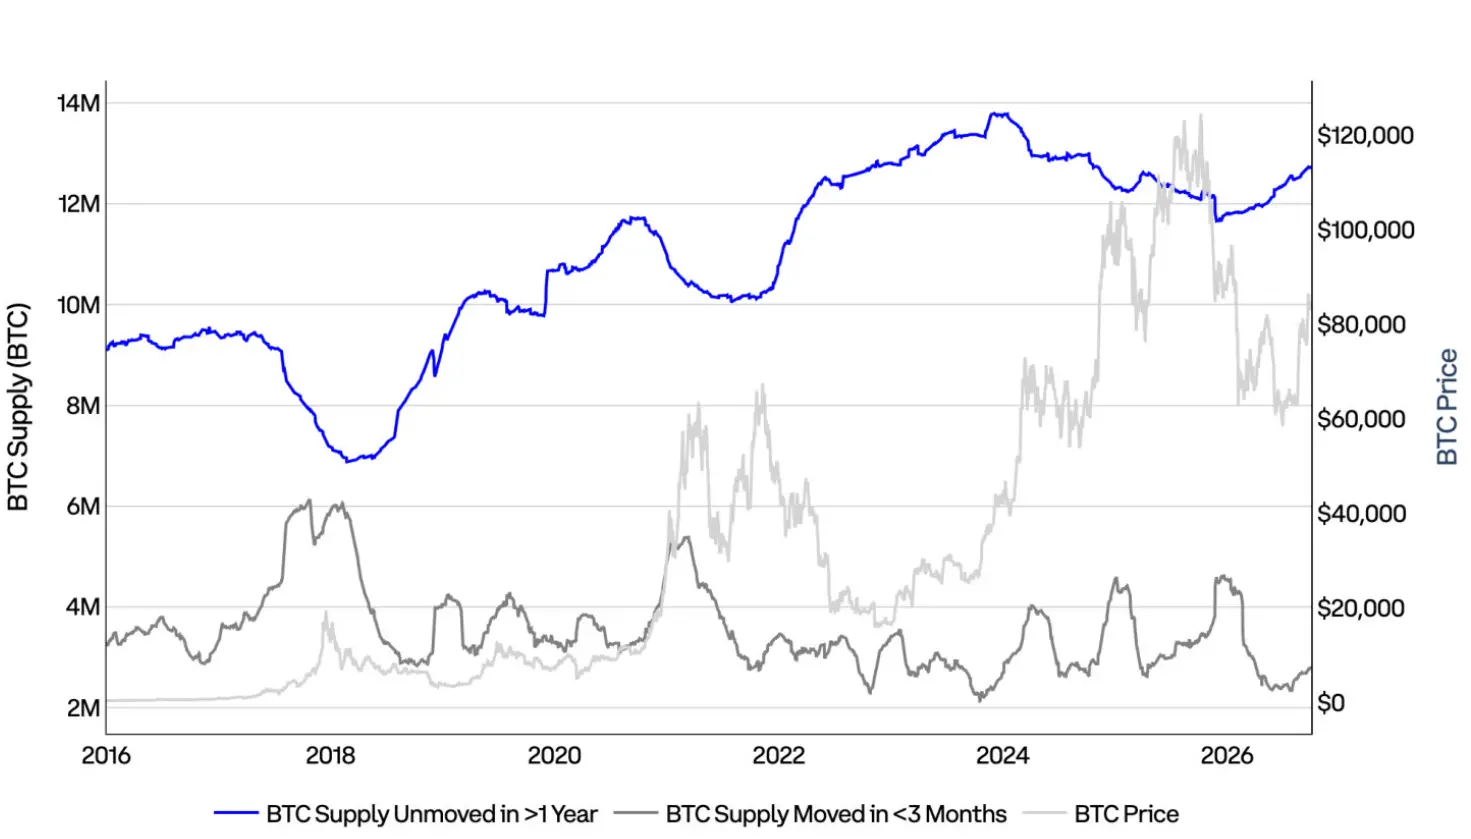
Figure: BTC supply that has not moved for over a year, BTC supply that has moved in the past three months, and BTC price.
BTC Puell Multiple (30-day Average)
The Puell Multiple is a fundamental on-chain indicator widely used in Bitcoin analysis to measure asset valuation relative to mining fundamentals. The specific calculation method is: the dollar value of the daily new issuance of BTC divided by the 365-day moving average of that daily issuance value.
This calculation helps determine whether Bitcoin prices are significantly oversold or overbought, especially compared to historical average mining income. It reflects the selling pressure and income status of miners relative to historical norms.
In the third quarter of 2026, the Puell Multiple rose from 0.67 to 1.02, surpassing the declining annual average of 0.83, indicating that as prices increased, miner revenues have returned to levels typically seen over the past year.
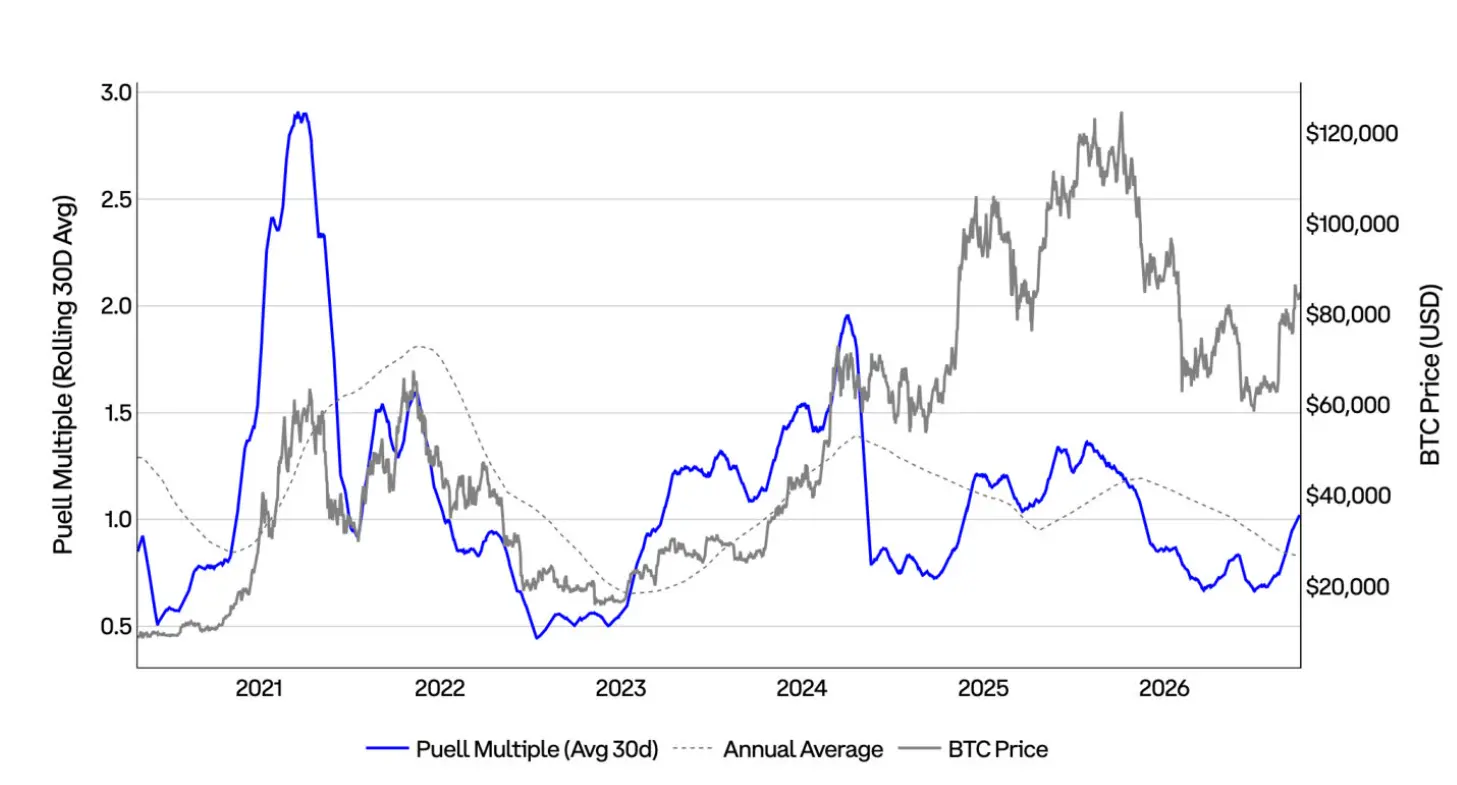
Figure: The 30-day rolling average of the BTC Puell Multiple, annual average, and BTC price.
BTC Long-Term Holder Net Position Changes
This chart compares the net position changes of long-term holders (LTH, holding for 155 days or more) with the net position changes of exchanges. We believe that the increase in long-term holders' positions, while exchange positions decrease, may indicate that investors are actively accumulating.
Applying this framework to the third quarter of 2026, it can be seen that long-term holders continued to accumulate in July, but around the price breakout in August, as tokens flowed back into exchanges, they shifted to a slight net sell. In September, both trends reversed: long-term holders' net position changes turned positive again, while exchange balances began to decline.
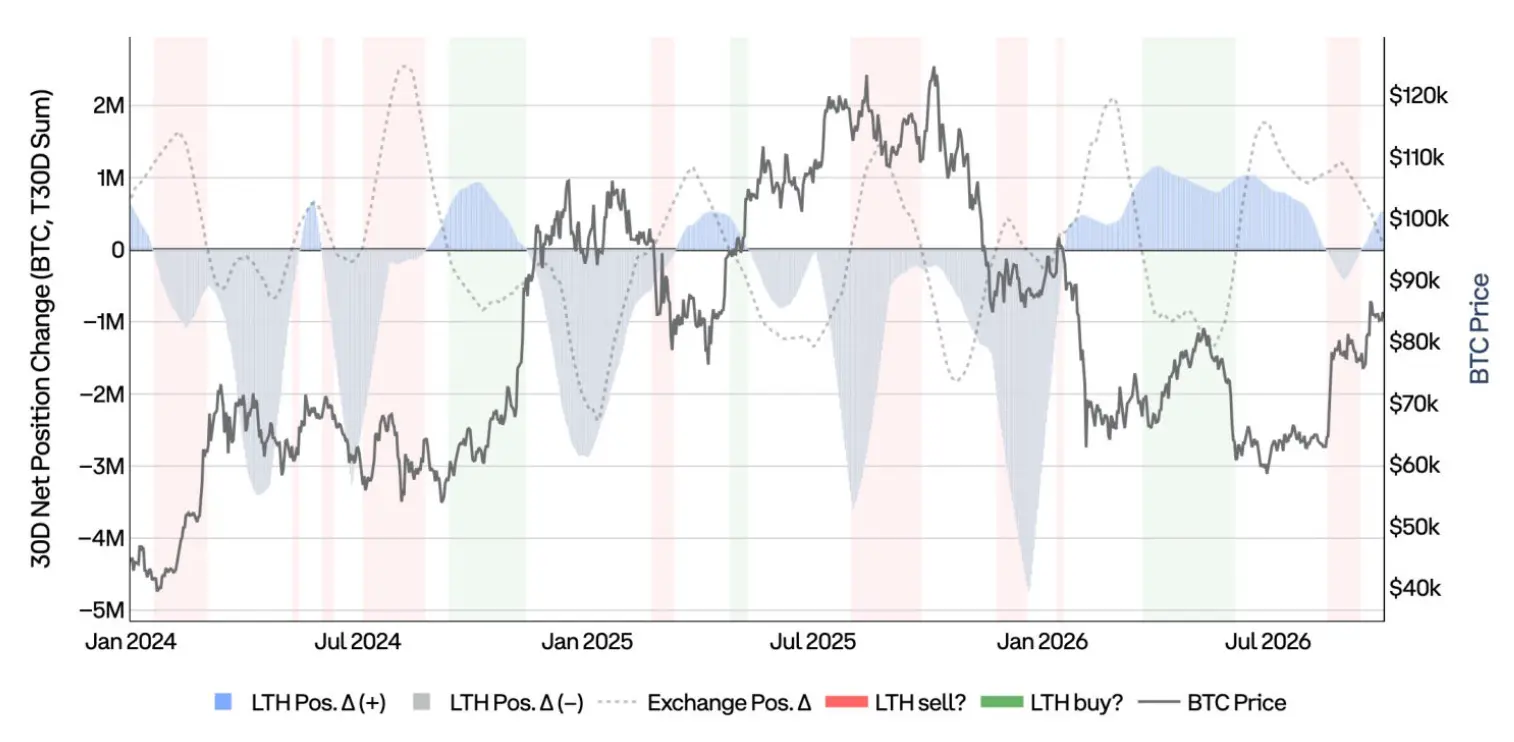
Figure: The 30-day net changes in long-term holders' positions and exchange positions, overlaid with BTC price.
BTC Derivatives Market
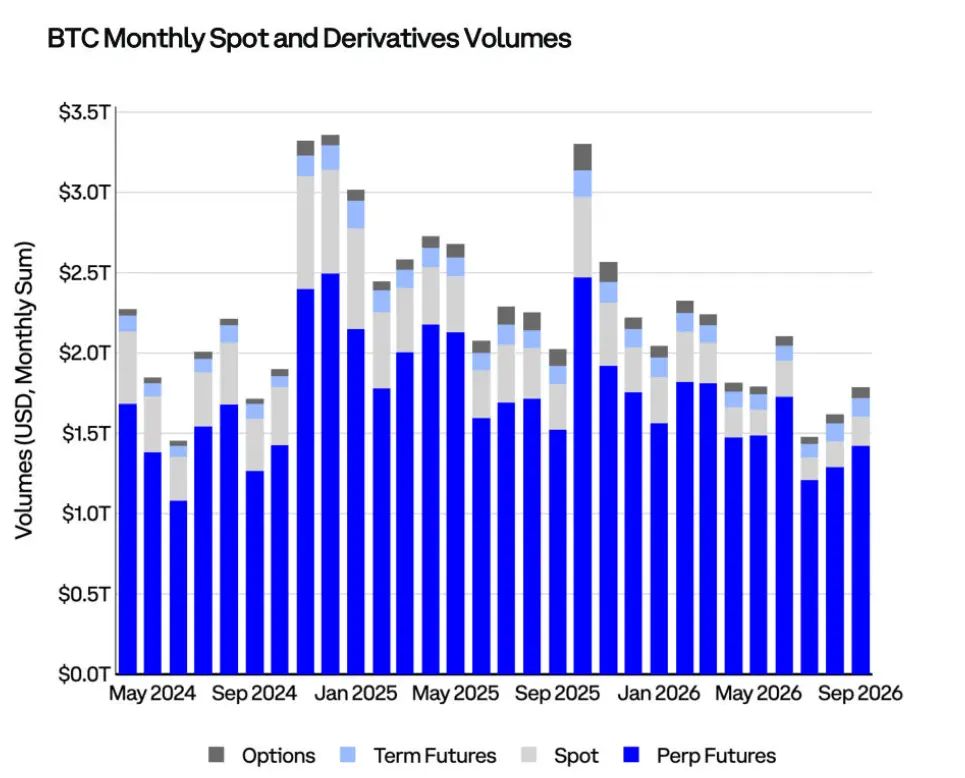
Figure: Monthly trading volume of BTC spot, perpetual contracts, futures, and options.
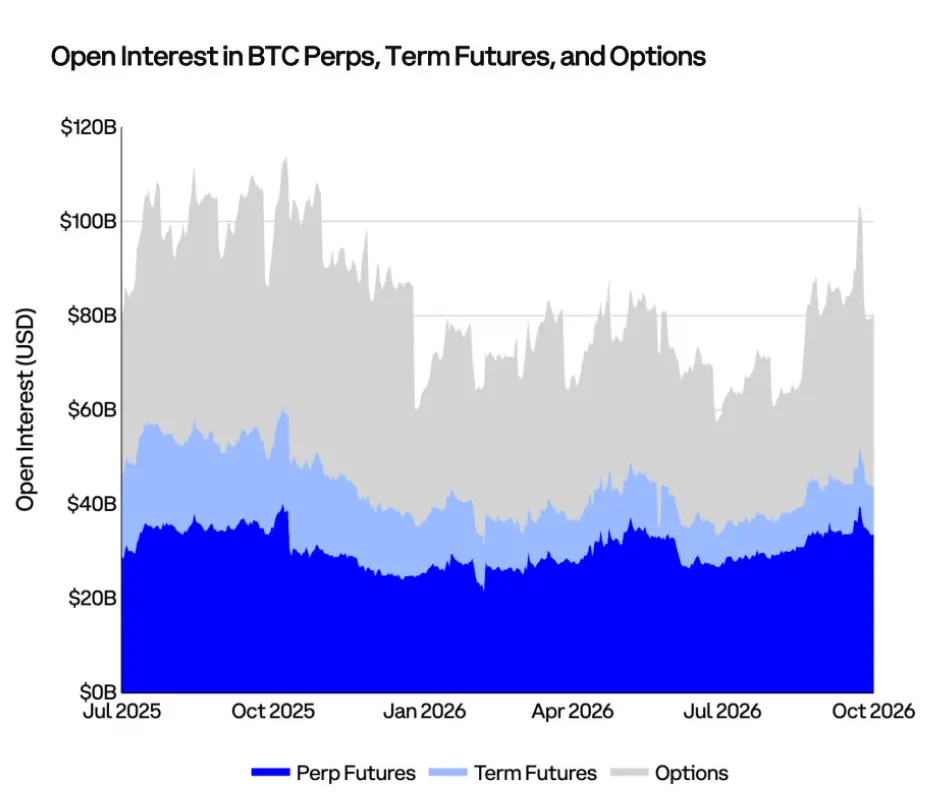
Figure: The nominal dollar value of open interest in BTC perpetual contracts, futures, and options.
Ethereum
Ethereum is an open-source blockchain platform where developers can run decentralized applications (dApps) and create and deploy smart contracts. Ether (ETH) is the native cryptocurrency of the Ethereum network, ranking second in market capitalization among all cryptocurrencies, only behind Bitcoin.
- Developers: Ethereum was proposed by Vitalik Buterin, who published the white paper in 2014 and launched the project in 2015. Co-founders include Gavin Wood, Charles Hoskinson, Anthony Di Iorio, and Joseph Lubin.
- Reference Price: Ether reference exchange rate (ETHUSD_RR), CME CF benchmark reference rate
- Bloomberg Code: XET Currency
- Circulating Supply: 122.2 million coins
- Total Value Locked in DeFi: $53.3 billion
- Inflation Rate: 0.88%
Ethereum: Key Points
- In the third quarter of 2026, the supply of ETH that had not moved for over a year increased by 7%, reaching 66.7 million coins; the tokens that last moved in the past three months decreased by 18%, down to 11 million coins. This indicates that holders generally continued to hold during the price increase rather than selling into the rise.
- As Ether rose by 71% in the third quarter of 2026, the net unrealized profit and loss (NUPL) measuring ETH market sentiment rebounded from -0.31 to 0.22, moving the indicator out of the "surrender" zone into the "optimistic/anxious" zone. MVRV rose from 0.70 to 1.19, with average holders returning to profitability for the first time since May.
- In the third quarter of 2026, Ethereum's DeFi total value locked (TVL) rose from $37 billion to $53 billion. After a year of decline, the share of stablecoin value held by L2 began to recover. The U.S. Ether spot ETF saw a net inflow of $3.1 billion this quarter, reversing the outflows from the first half of the year, with assets growing from $10.6 billion to $21.6 billion. In September, L2 fees significantly increased, primarily driven by a surge of activity on the Robinhood Layer 2 network in the first week of the month. Overall, these data indicate that as prices rebound, the scope of ecosystem participation is also expanding.
ETH Support and Resistance Levels
This heatmap marks support and resistance levels based on confirmed price turning points in the 4-hour candlestick chart. The trading volume at each turning point is assigned to a narrower price range, given higher weight before the price retests that position, gradually decaying over time. Thus, the darker the range, the more significant the price level in the market. Blue indicates support below the current price, while gray indicates resistance above the current price.
At the end of the third quarter of 2026, the price of Ether was around $2,685, positioned just below the resistance zone of $2,685 to $2,695, while slightly above the support zone of $2,640 to $2,685. After breaking through in August, the price entered a narrow, dense trading area. The strongest support zone below is located between $2,335 and $2,380, followed by the market cost basis of about $2,265 and the 200-day moving average of about $2,105.
The low of about $2,355 on September 2 fell within this support zone, and throughout the month, Ether maintained above this area. This resilience contrasts with the first half of the year when prices were below the market cost basis for most of the time. The high of about $2,800 this quarter remains a level that needs to be broken through.
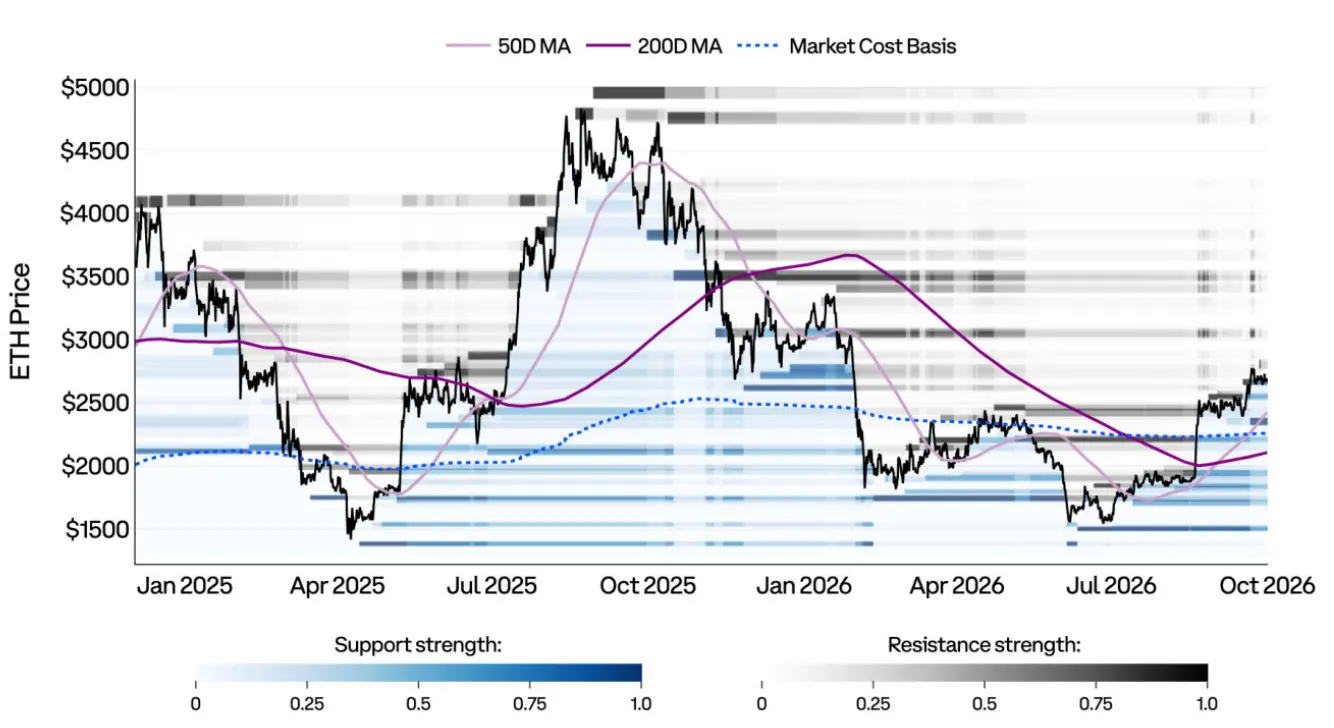
Figure: ETH support and resistance heatmap, overlaid with the 50-day moving average, 200-day moving average, and market cost basis.
ETH Net Unrealized Profit and Loss (NUPL)
This chart measures investor sentiment through net unrealized profit and loss (NUPL). This indicator is the difference between relative unrealized profits and relative unrealized losses. The ranges in the chart reflect investor sentiment from different perspectives. Due to the unpredictability of the market, each stage is described with two opposing terms. These stages follow traditional market cycles: when the market recovers from a deep bear market, it often goes through "surrender → hope → optimism → belief → euphoria"; while entering a bear market after reaching an all-time high, it may go through "greed → denial → anxiety → fear → surrender."
In the third quarter of 2026, Ether rose by 71%, recovering from the "surrender" phase, with NUPL rising from -0.31 to 0.22, and by the end of the quarter, average holders were back in profit.
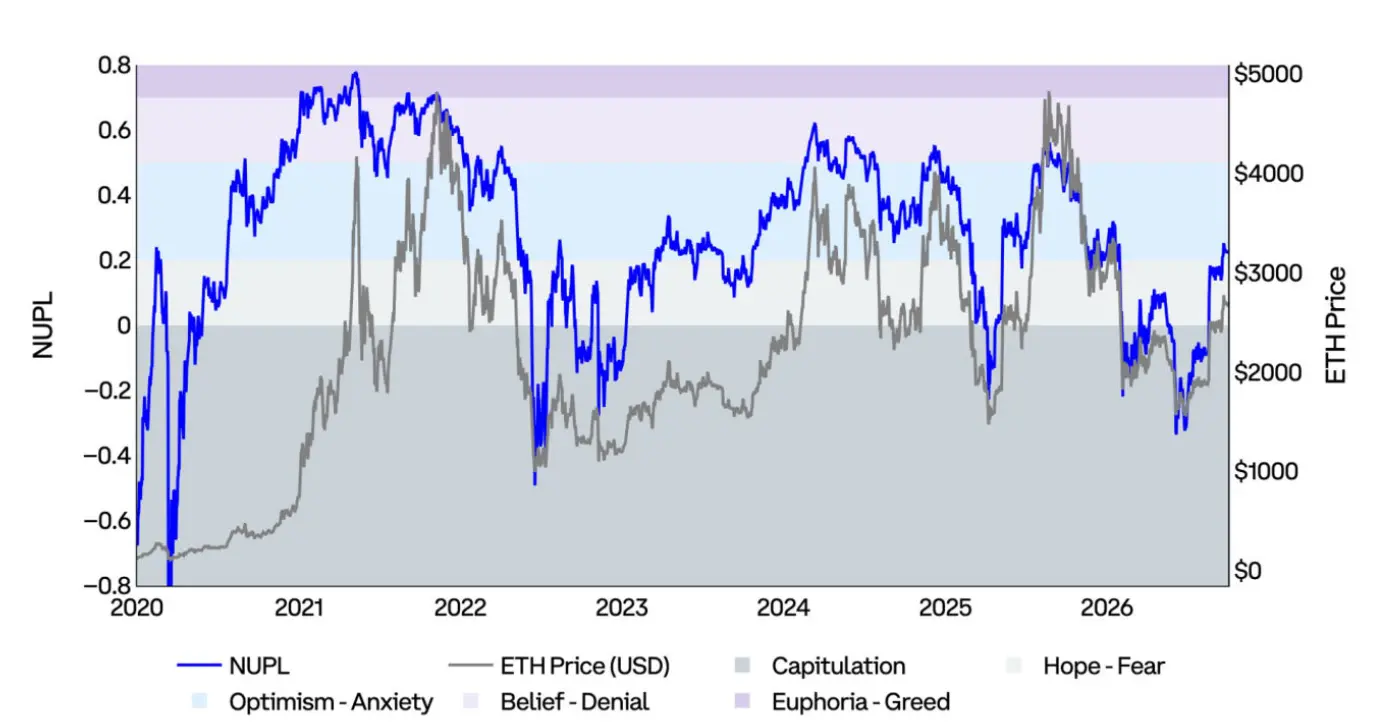
Figure: ETH net unrealized profit and loss and ETH price, with different sentiment ranges indicated.
ETH Realized Price and MVRV
Realized price (or "on-chain cost basis") is valued based on the price at which each Ether last transacted on-chain, calculating the average price of all Ether supply.
The MVRV ratio compares market value (spot price) to realized value (realized price) to measure the multiple of investors' unrealized profit and loss:
- MVRV of 2.0: Price is twice the average cost (average holder's return is 2 times).
- MVRV of 1.0: Price equals average cost (average holder is at breakeven).
- MVRV of 0.85: Price is 15% lower than average cost (average holder is down 15%).
Extreme values of MVRV help identify when the market is overheated or undervalued, as well as when investors' profit levels significantly deviate from the average.
In the third quarter of 2026, Ether rose by 71%, with MVRV rising from 0.70 to 1.19, allowing average holders to return to profitability for the first time since May. MVRV remains below its median of 1.3 since 2020, indicating that despite the price increase, valuations remain relatively moderate.
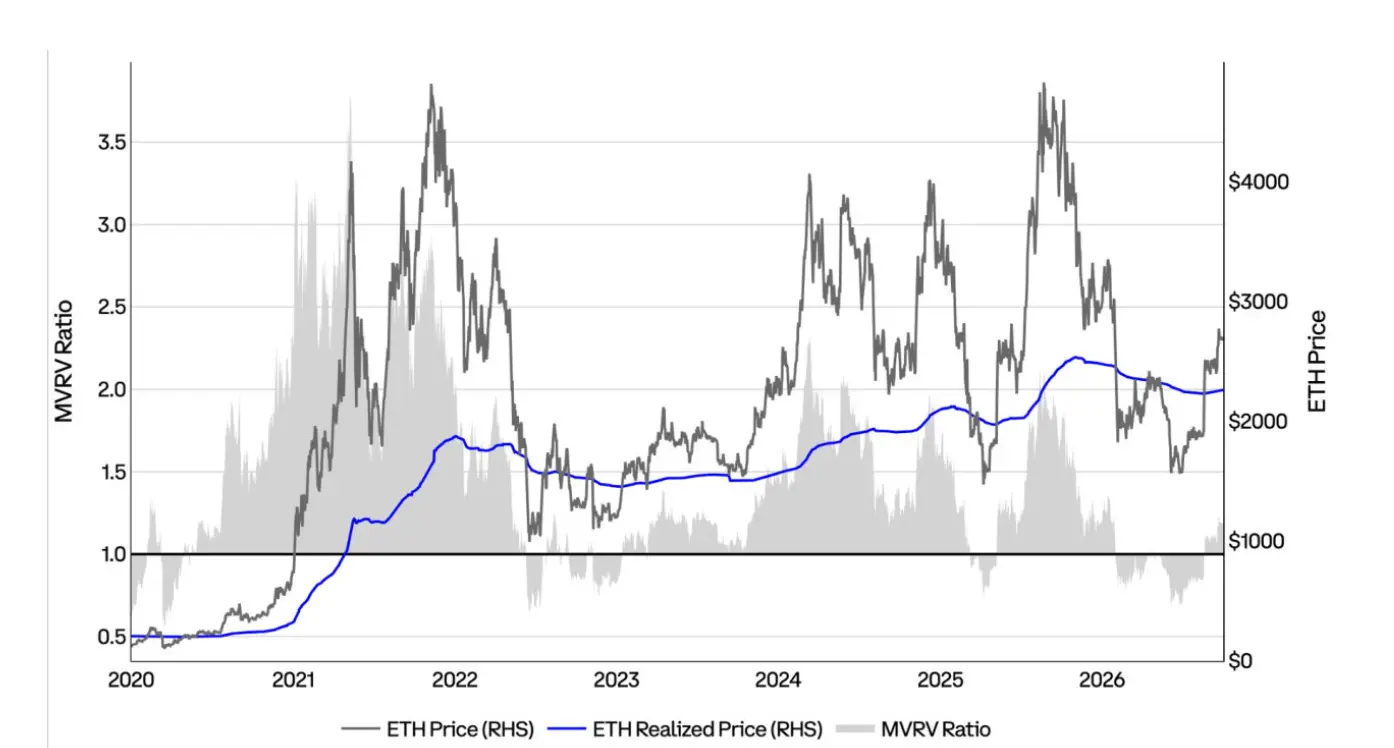
Figure: ETH spot price, realized price, and MVRV ratio.
ETH Supply Profit and Loss Status
This chart shows the proportion of ETH in profit relative to the total supply, with two statistical boundaries set at positive and negative 1 standard deviation. These represent important warning zones and accumulation zones, respectively. This indicator helps understand the holding status of investors and assess during what periods the majority of the supply is in profit or loss.
In the third quarter of 2026, this indicator rose from 28% to 63%, moving back above the negative 1 standard deviation boundary, leaving the historical accumulation zone but still significantly below the 87% warning line.
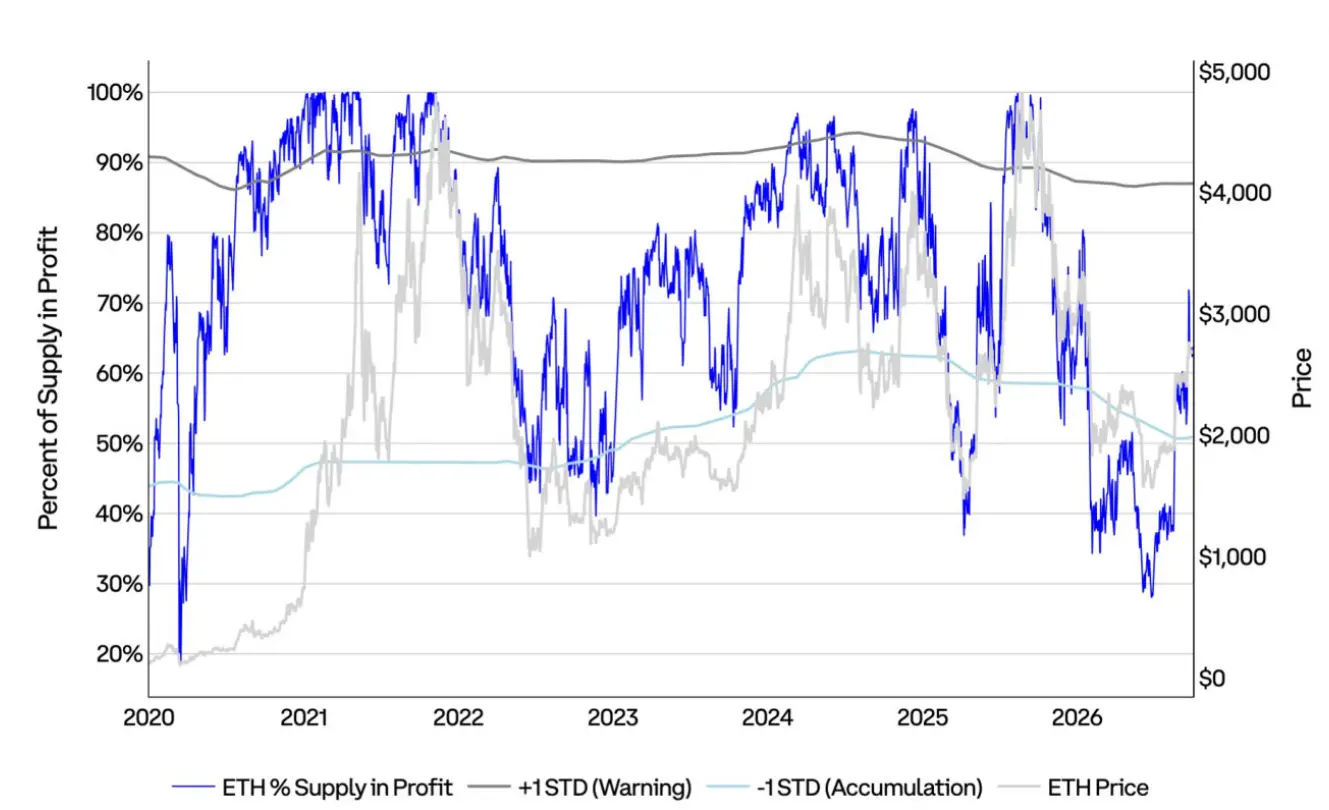
Figure: Proportion of ETH in profit, positive 1 standard deviation warning line, negative 1 standard deviation accumulation line, and ETH price.
ETH Dormant Supply and Active Supply
This chart compares the circulating supply of ETH that has not moved for at least a year with the circulating supply of ETH that has been active in a short time (less than three months).
In the third quarter of 2026, the supply of ETH that had not moved for over a year increased by 7%, while the tokens that last moved in the past three months decreased by 18%, down to 11 million coins. This indicates that holders generally continued to hold during the price increase rather than selling into the rise.
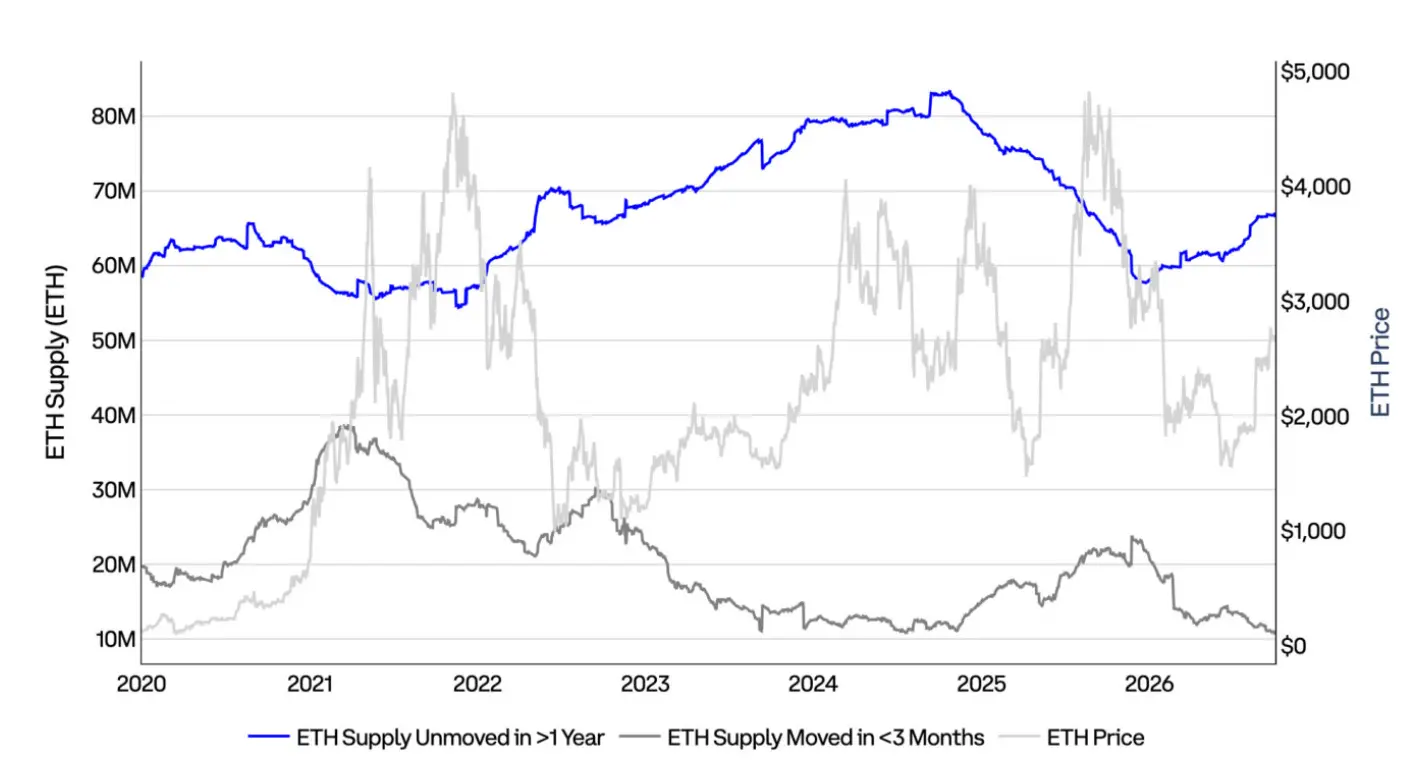
Figure: ETH supply that has not moved for over a year, ETH supply that has moved in the past three months, and ETH price.
ETH Derivatives Market
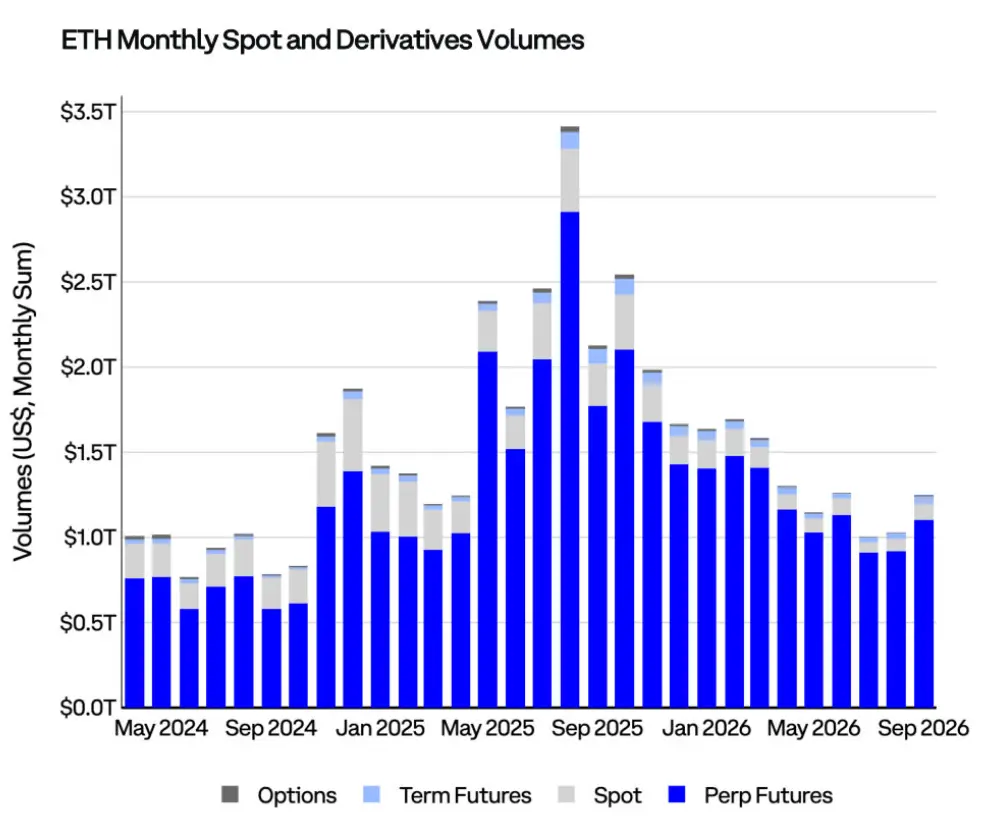
Figure: Monthly trading volume of ETH spot, perpetual contracts, futures, and options.
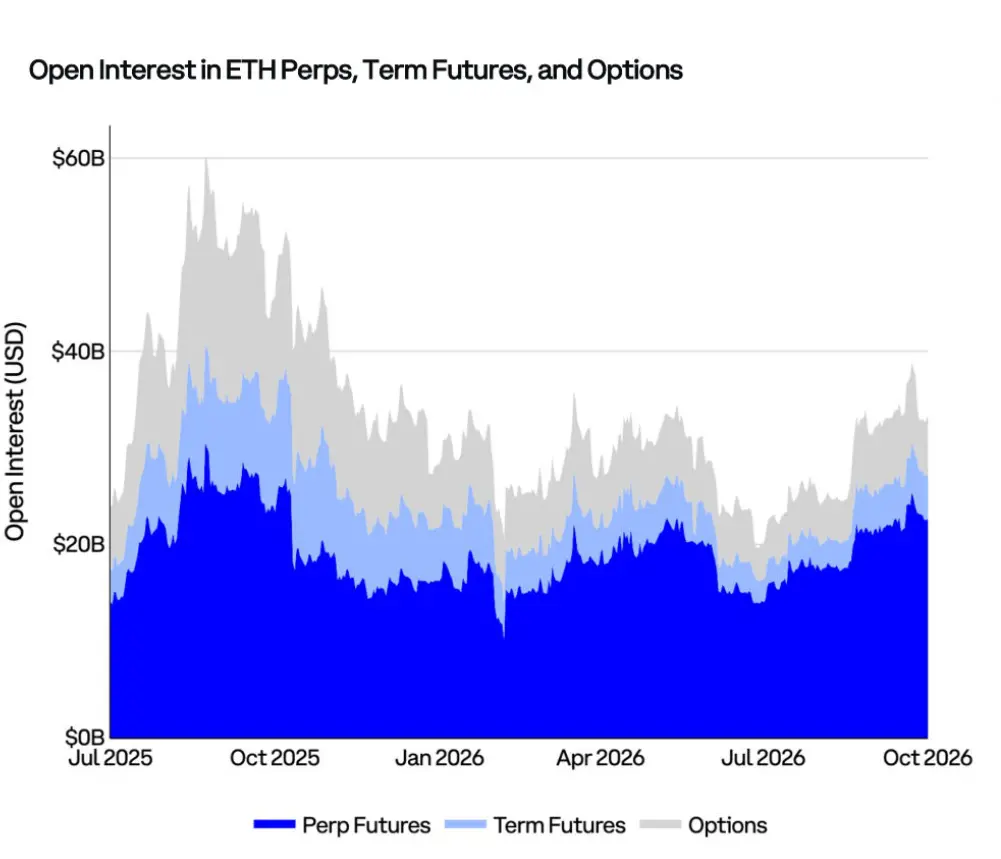
Image: The nominal value in USD of open contracts for ETH perpetual contracts, fixed-term futures, and options.
L2 and Ethereum Mainnet
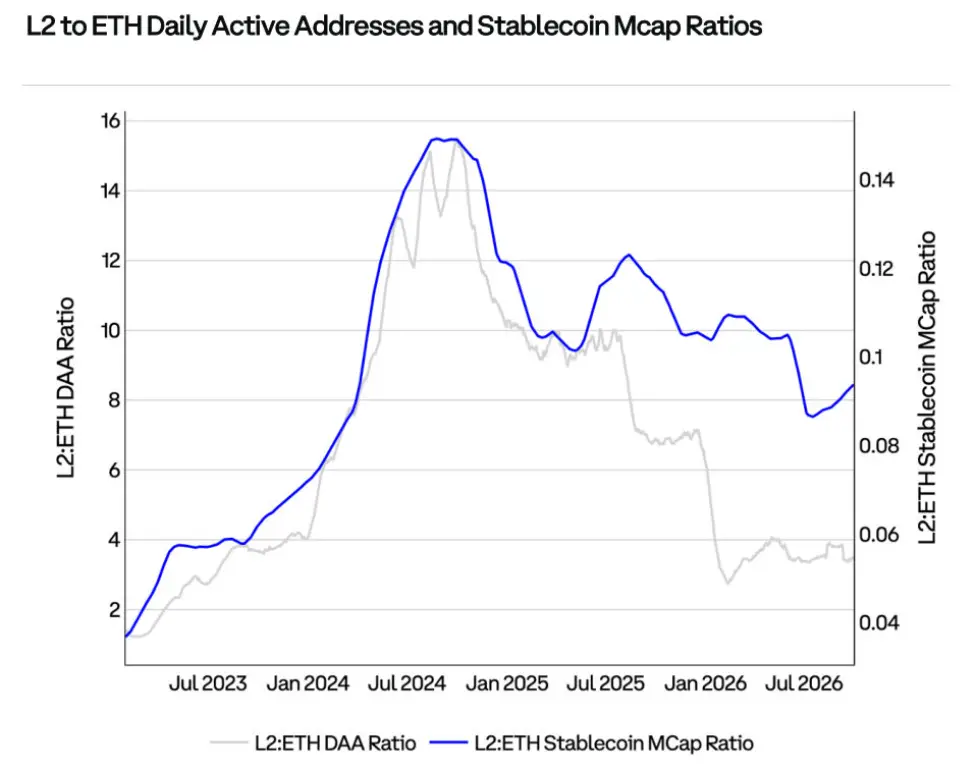
Image: The ratio of daily active addresses on L2 compared to the Ethereum mainnet, as well as the market cap ratio of stablecoins. A declining ratio indicates that activity and stablecoin liquidity are shifting from L2 to the Ethereum mainnet.
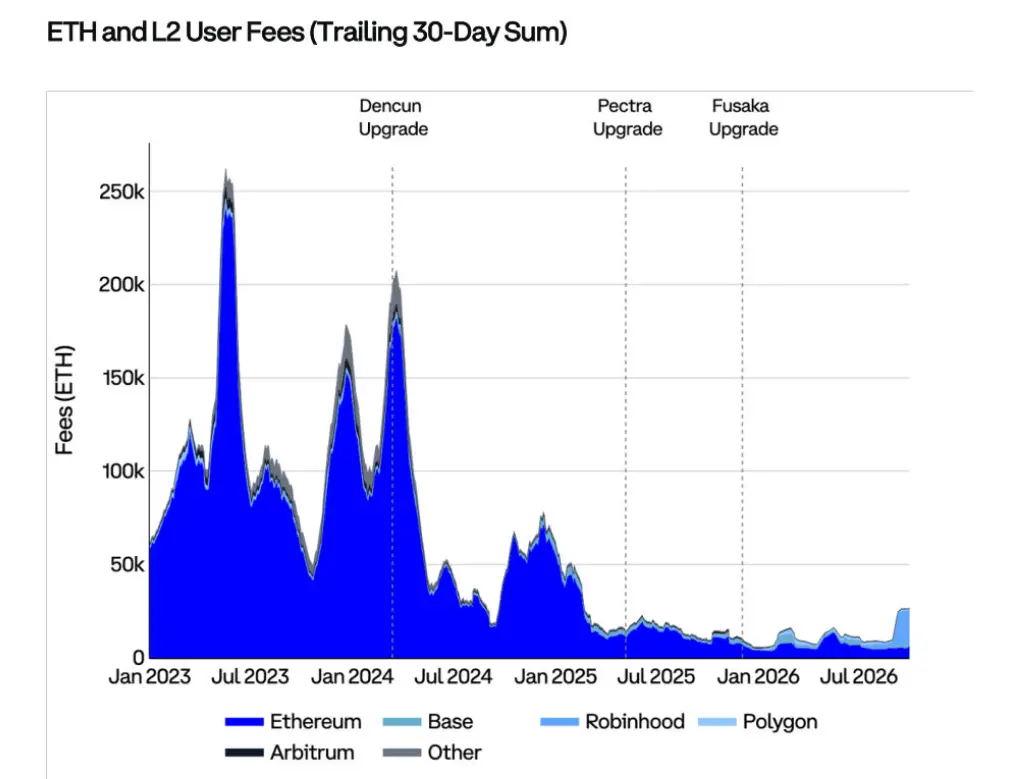
Image: User transaction fees on Ethereum, Base, Robinhood, Polygon, Arbitrum, and other networks denominated in ETH.
 Risk warning




Popular articles