




Under high volatility in AI, after the APP surged by 50% in a week, has the cash flow pricing stabilized?

 Why did the AI stocks collectively drop while the APP instead rose by 50% in three days?
On November 4, after the market closed, AppLovin disclosed its third-quarter report. On November 5, U.S. stocks recorded their largest single-day drop since April 2025, with the Nasdaq Composite falling 5.52%, the Philadelphia Semiconductor Index dropping about 12%, Nvidia down 9.26%, and AMD down 17.26%.
On the same day, AppLovin rose 31.04%, closing at $356.10, and continued to rise over the next two trading days, closing at $410 on November 9, with a cumulative increase of 50.87% over three trading days.
Why did it rise by 50% while AI stocks fell together? If the market continues to price assets solely based on growth rates, assets labeled with AI should not show such a large divergence. Earnings expectations, positioning, and short covering may amplify single-day market movements, but when breaking down this earnings report, the gap in cash flow quality between it and its peers is significant enough to warrant serious attention.
This earnings report from AppLovin provides a paradigm: it can continuously convert growth into free cash flow and can support the next round of growth with its own cash flow. This article answers three questions: why cash flow is important, whether e-commerce can take over, and what to look for after a 50% increase. The gap in cash flow quality between AppLovin and its peers will ultimately translate into valuation differences; the question is how long this price difference can be maintained.
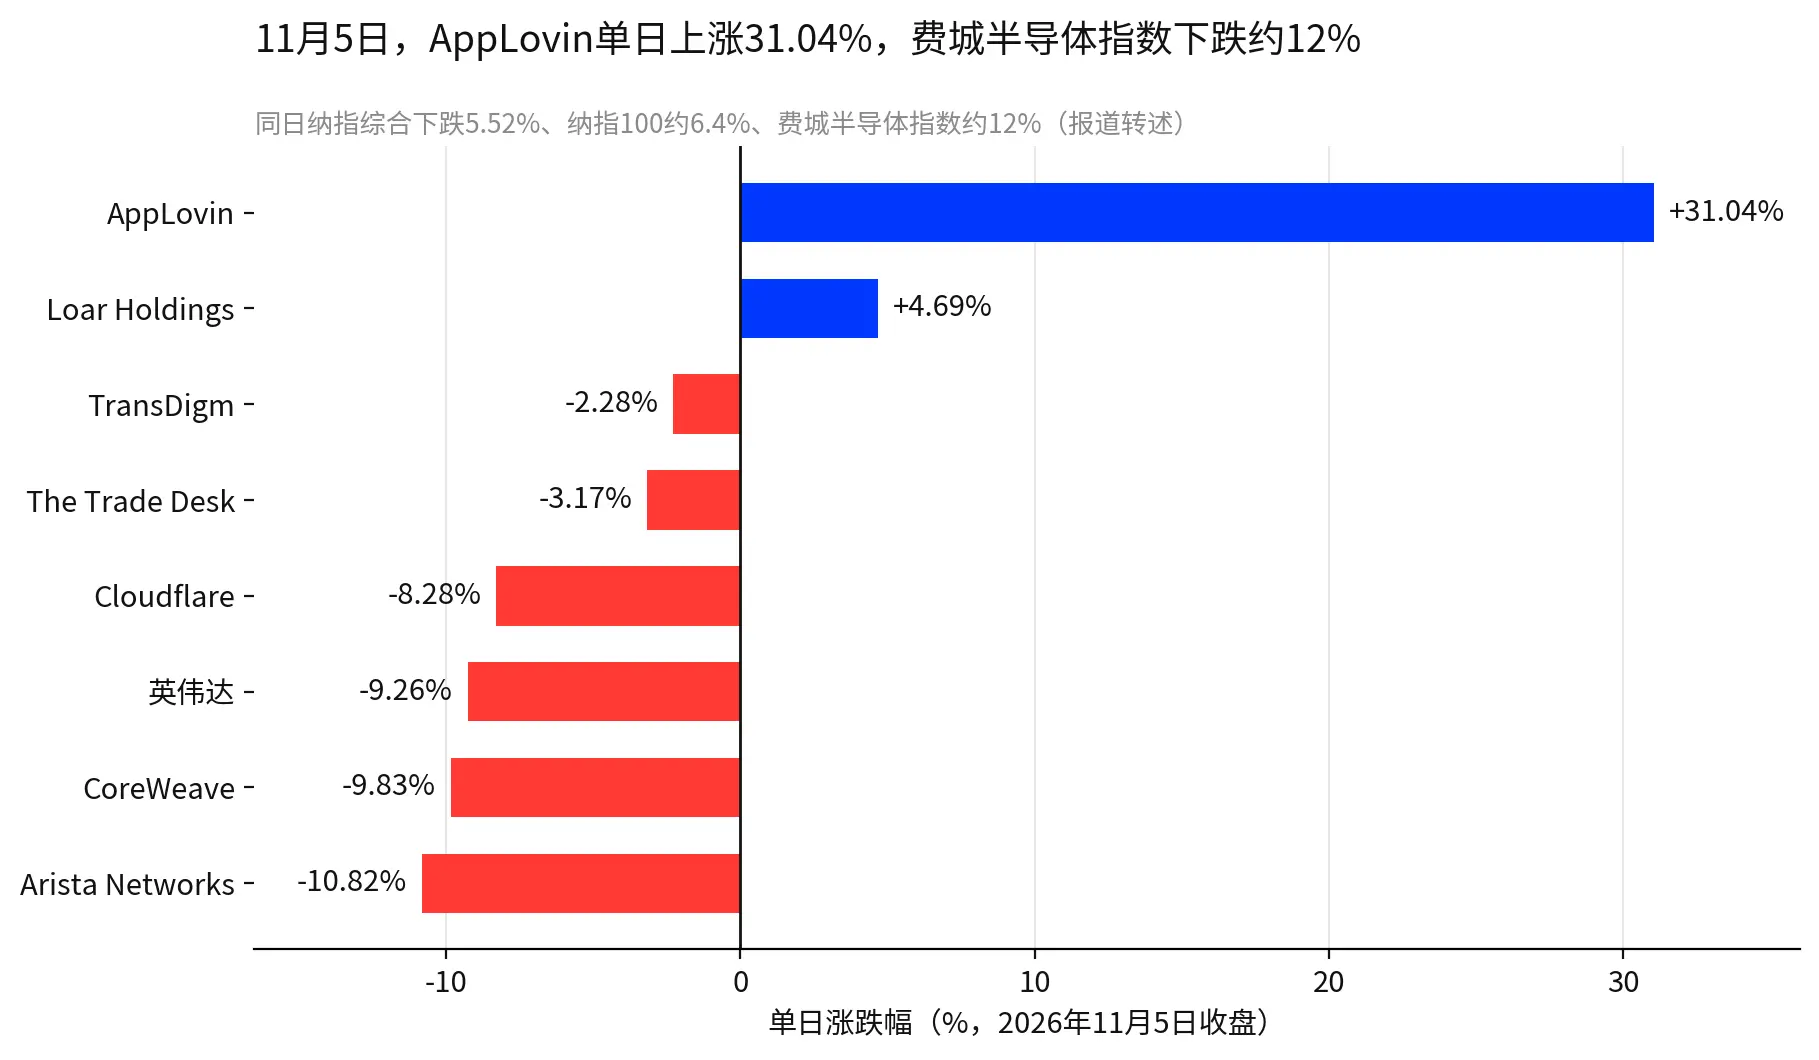
Figure 1: This chart shows the divergence on the same day. AppLovin's rise occurred during the same trading period as the decline of the Philadelphia Semiconductor Index.
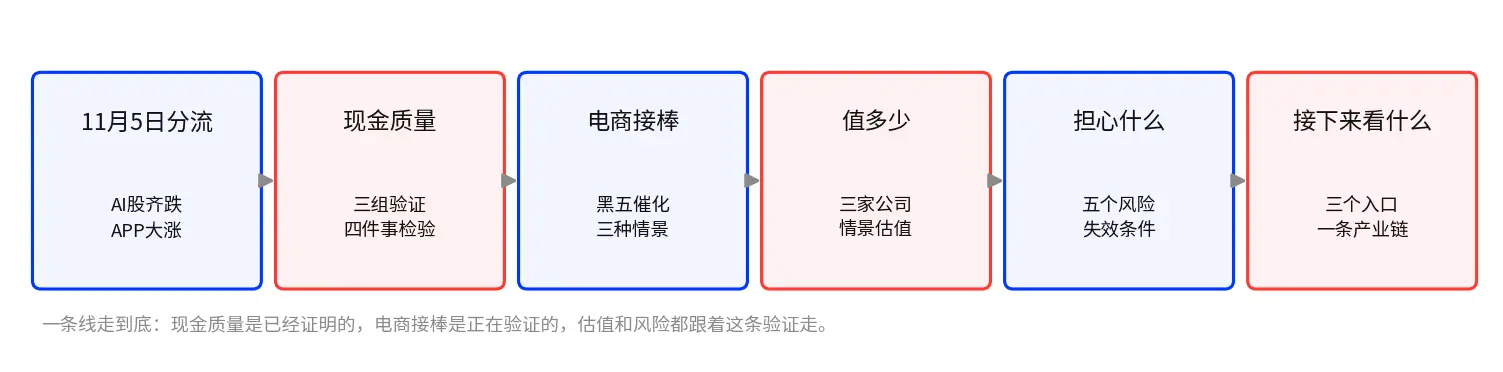
Figure 2: This chart outlines the clues of the entire text: cash quality has already been proven, the e-commerce transition is still being validated, and valuations and risks follow this step.
### Behind the 65.9% Net Profit Margin: How Does APP Turn Advertising Growth into Real Cash?
Asset-Light: Serving One More Display with Almost Zero Marginal Cost
First, let's look at where the profit margin comes from. AppLovin started in mobile gaming and later shifted its focus to an advertising platform, where its self-developed advertising model determines how much to bid for each display and who to show it to. The platform does not create content, does not hold inventory, and does not build data centers; the model and platform are fixed costs, and the marginal cost of serving one more display is almost zero. As revenue increases, the bulk of the incremental revenue directly contributes to profit. In the third quarter, revenue was $2.185 billion, with total operating expenses of $567 million, accounting for 26% of revenue, lower than the 27.4% in the second quarter. As long as revenue continues to grow, the profit margin can conditionally remain high, which is the basis for observing the trend of profit margins.
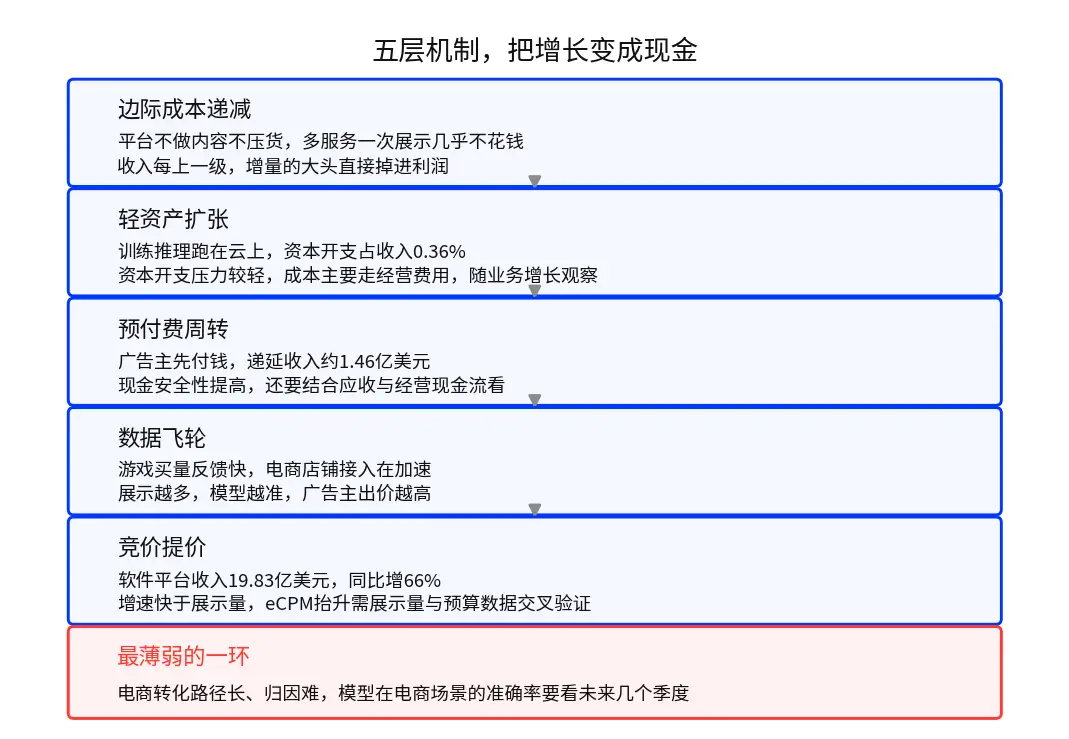
Figure 3: This chart connects the five-layer mechanism of the business model from top to bottom, with the weakest link at the bottom.
$1.421 Billion in Free Cash Flow and $1.439 Billion in Net Profit, Almost Aligned
Profit must be converted into cash to count. Advertisers typically prepay for advertising, with the company receiving money before placing ads. In the third quarter, deferred revenue was approximately $146 million, an increase of $13 million from the second quarter. Prepayments enhance the safety of cash, but looking at this single metric alone does not prove the health of the cash cycle; accounts receivable and operating cash flow must also be considered: accounts receivable in the third quarter was $528 million, with a turnover period of about 22 days calculated as end-of-period receivables ÷ quarterly revenue × 91 days, which is a rough estimate (based on end-of-period receivables, not standard average accounts receivable turnover days), significantly shorter than the 60-90 days common for SaaS companies. The operating cash flow for the quarter was $1.429 billion, minus less than $8 million in capital expenditures, resulting in free cash flow of $1.421 billion, almost equal to the net profit of $1.439 billion for the quarter.
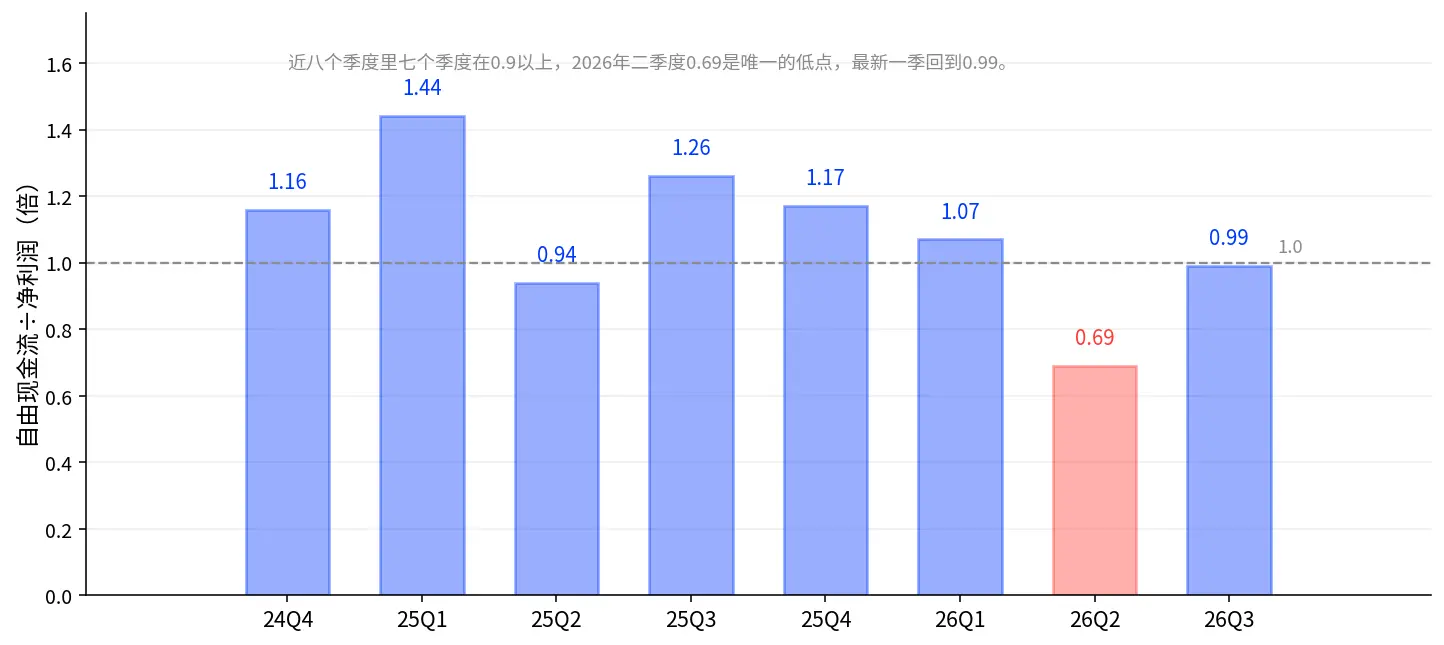
Figure 4: This chart shows cash content. In the past eight quarters, seven quarters had free cash flow ÷ net profit above 0.9, with the only low point being 0.69 in the second quarter of 2026, and the latest quarter returning to 0.99.
0.99 is worth celebrating, but it is more important to track it. The ratio was only 0.69 in the second quarter of 2026, with single-quarter free cash flow of $869 million, significantly lower than the net profit of $1.267 billion for that quarter. Four things to watch going forward: whether operating cash flow growth is synchronized with net profit, whether accounts receivable growth continues to be lower than revenue growth, whether cloud service and model costs begin to erode cash flow, and whether buybacks rely on continuously generated free cash flow.
Four Things: Is Profit Real Cash, Who Funds Growth, Is Profit Stable, Who Pays for the Next Round
When looking at any company, focus on four things. Is profit real cash, who funds growth, is profit stable, who pays for the next round.
|----------|------------|------------------------|--------------------| | What to Look For | How to Calculate | AppLovin's Answers | Good Standards | | Is profit real cash? | Free cash flow ÷ net profit | 0.99 (latest quarter), seven of the last eight quarters above 0.9 | Close to or above 1 | | Who funds growth? | Capital expenditures ÷ operating cash flow | 0.06% (latest quarter) | Light capital expenditure pressure, while observing cloud service costs | | Is profit stable? | Net profit margin over the last eight quarters | 44%-67% range, high volatility | Stable at high levels for multiple consecutive quarters | | Who pays for the next round? | Buyback authorization ÷ rolling FCF | Remaining authorization of $3.6 billion ÷ $4.866 billion | Sustainable buybacks, no repeated financing |
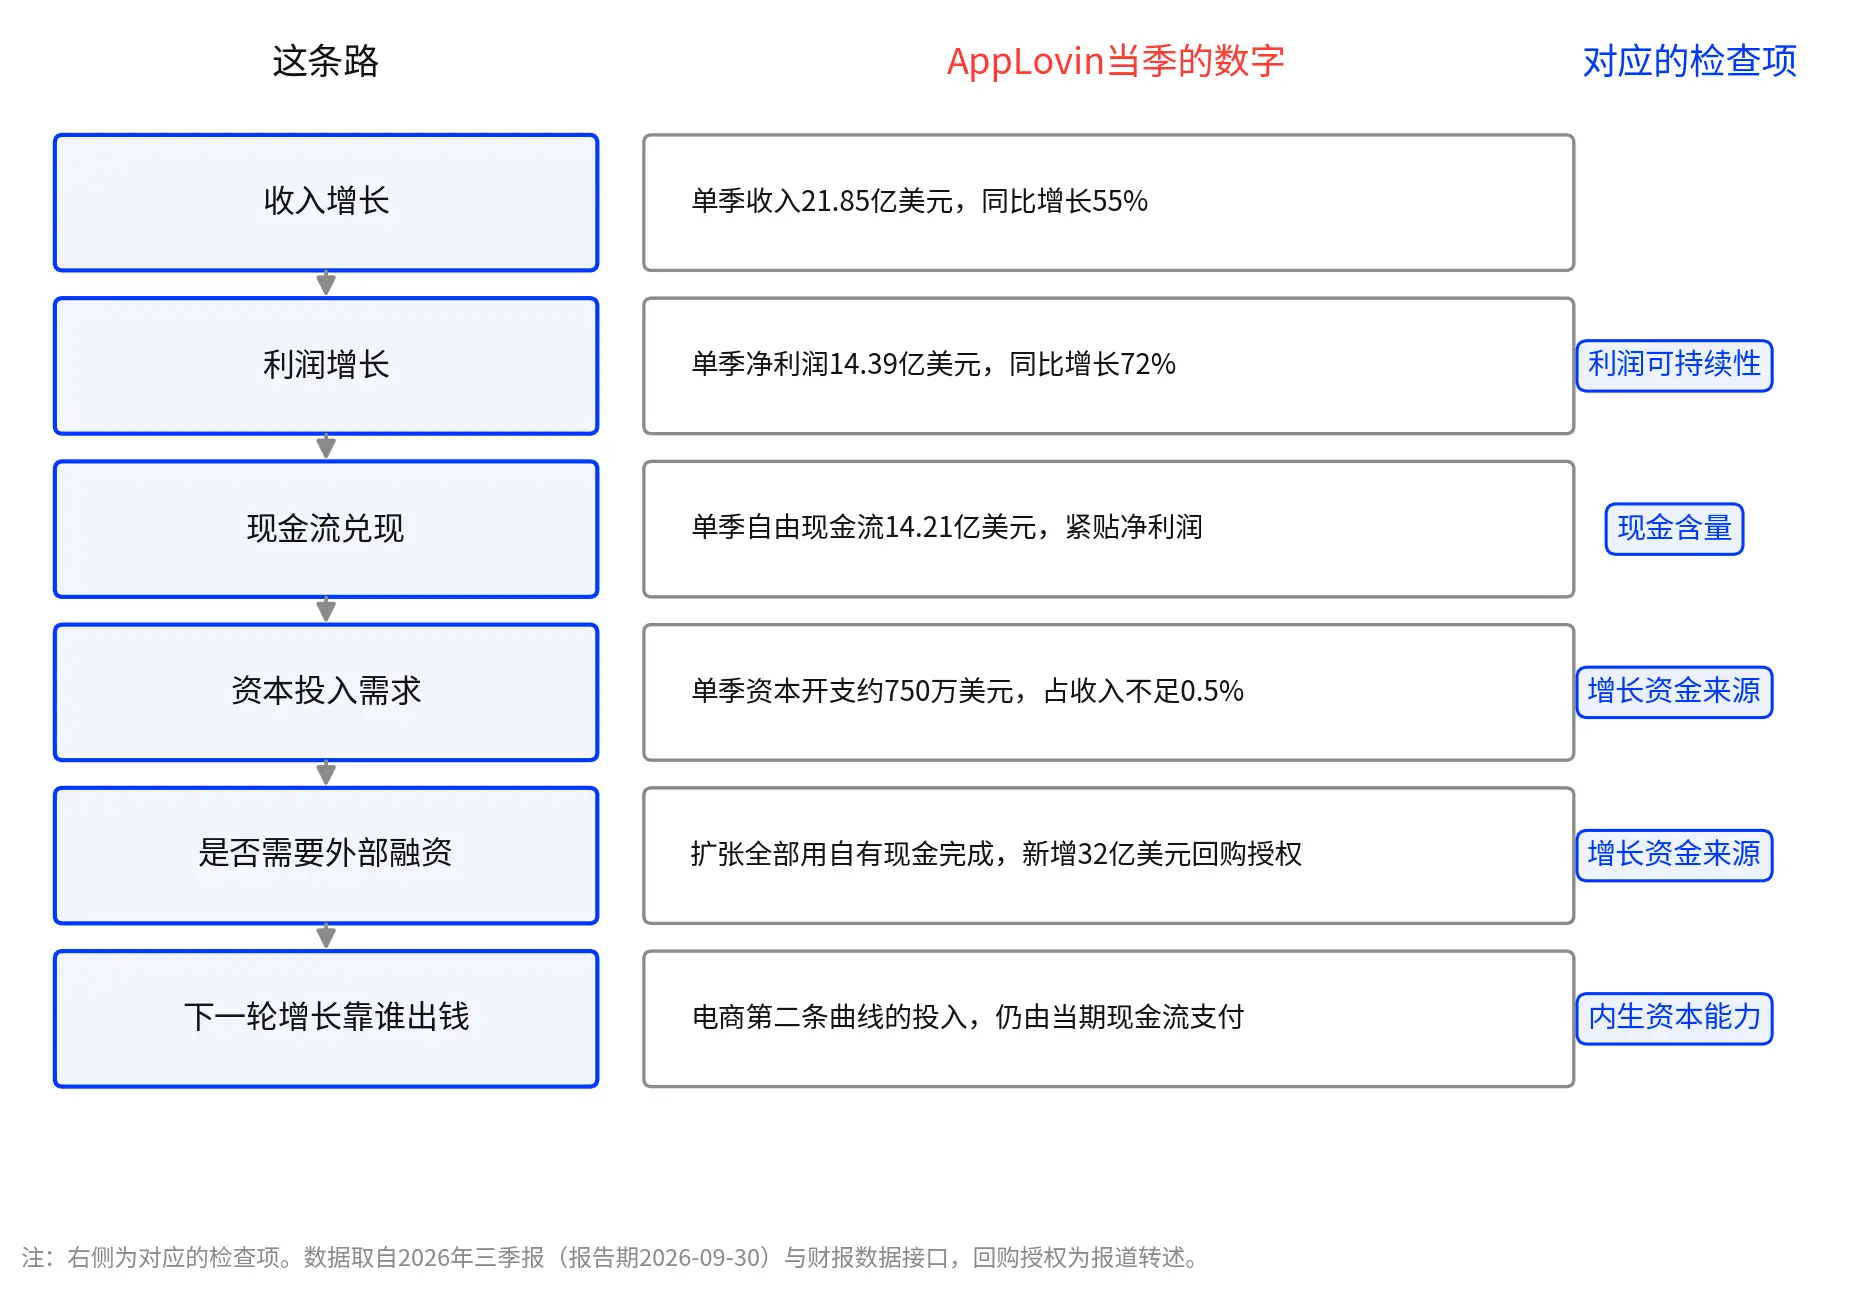
Figure 5: This chart shows the correspondence between the chain and the four things. The left side is the chain from growth to cash, and the right side shows the corresponding checks for each link.
Two pieces of data clarify the situation. Low capital expenditures do not mean expansion has no cost: unlike cloud vendors that need to build their own data centers, AppLovin's expansion does not require simultaneous investment in massive fixed assets, but model training and inference run on cloud services, and cloud service costs are reflected in operating expenses, which will grow with business expansion. Regarding buybacks, the $3.6 billion is the remaining authorization amount, not the amount already repurchased; compared to the rolling free cash flow of $4.866 billion, the authorization can cover cash flow for more than a year, and the actual execution pace is subject to the company's disclosures.
TTD Gets 120 Times, APP Only Gets 27.5 Times, the Market is Betting on Different Things
Looking at just one earnings report, it is hard to tell whether the 65.9% net profit margin is high or low; it needs to be compared with peers. What is truly worth dissecting is the counterintuitive comparison with The Trade Desk: TTD's net profit margin in the third quarter was only 5.2%, yet the market gives it about a 120 times price-to-earnings ratio. AppLovin's net profit margin is 65.9%, but the market only gives it about 27.5 times.
Breaking it down, TTD's 5% comes from sales expenses accounting for about 35% of revenue, as programmatic advertising requires a large sales team to service advertisers. AppLovin is a self-service platform, with sales expenses accounting for only about 8% of revenue. One possible explanation is that TTD's 120 times is buying an "option for future profit margin improvement," while AppLovin's 27.5 times is buying "certainty on how long the current profit margin can be maintained"; this is just one interpretation, unverified by the market.
The market is not unaware of AppLovin's higher profit margin; it is skeptical about whether this profit margin can withstand the next competitive cycle. TTD's 120 times is not buying current profits, but future imaginative space. AppLovin's 27.5 times is not buying future imagination, but how long the current cash flow can be sustained. The two markets are betting on different things.
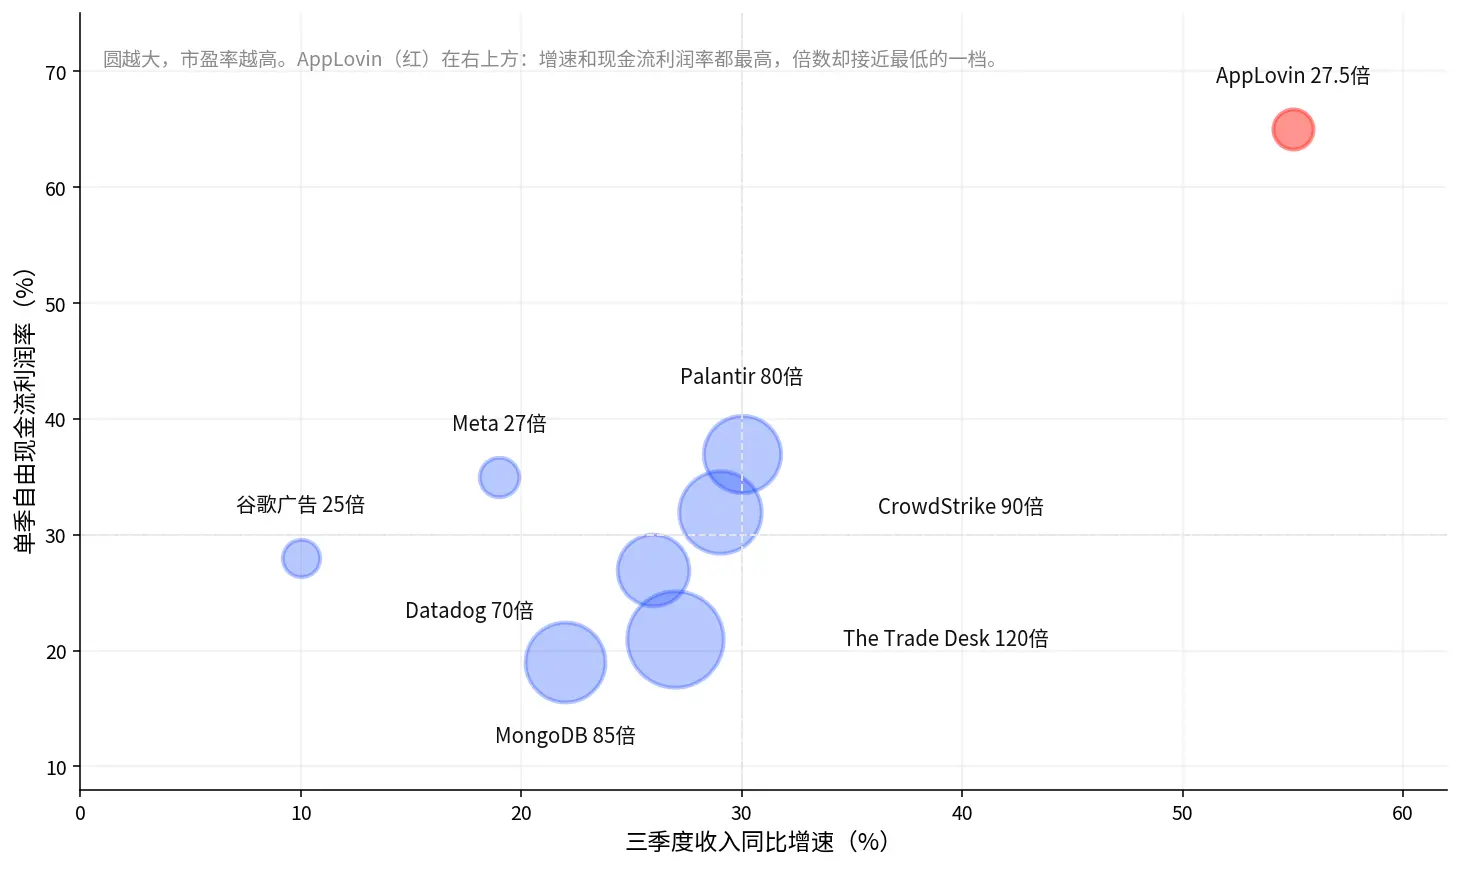
Figure 6: This chart provides a panoramic reference of peers. The horizontal axis is the revenue growth rate for the third quarter, and the vertical axis is the single-quarter free cash flow profit margin, with the size of the circles representing the price-to-earnings ratio. There are differences in reporting periods and accounting standards among companies, and this is only for magnitude comparison, with Meta and Palantir being the two core comparables discussed in the third section.
### Beyond Game Advertising, Can E-Commerce Support APP's Second Growth Curve?
Game advertising has already contributed to existing profits, while e-commerce determines future growth potential; this is the most important suspense of the entire text.
Store Integration Accelerates: Are Customers Increasing, and Is the Advertising Budget Keeping Up?
Tracking this matter has a publicly available weekly update scale. Citigroup's Store Leads data shows that as of November 6, the number of global e-commerce stores using its advertising platform reached 21,011, a weekly increase of 3.1%, with 7,018 U.S. stores integrated with Shopify, an increase of 205 stores in a week, and the integration speed has accelerated since August (report paraphrased, 11-10).
The increase in the number of stores only indicates "more merchants have integrated," which does not mean they have already moved their advertising budgets over, nor does it mean revenue has been recognized. In the third quarter, software platform revenue was $1.983 billion, a year-on-year increase of 66%, which is faster than the growth of advertising displays, indicating that each display may be worth more, meaning eCPM is rising. However, this "more valuable" aspect cannot be assessed by revenue alone; three things must be compared: whether the advertising display volume has changed synchronously, whether advertisers have truly increased their budgets, and whether the conversion effect of the ads is good. Only when these three align can it be confirmed that eCPM is genuinely increasing.
It is crucial to distinguish three steps: store integration → budget allocation → revenue recognition. These are three separate matters with a time lag in between. Just because a merchant opens a store today does not mean they will spend money tomorrow, nor does it mean revenue can be recognized in this quarter.
So why is the market still willing to give a premium? Because the budget pool for e-commerce advertisers is much larger than that for games, and e-commerce spending is part of daily operations, with money being spent throughout the year, unlike game user acquisition, which follows new games and versions. Therefore, e-commerce is seen as a second growth curve: the imaginative space is large, but it is still in the "watching integration, waiting for budgets, verifying revenue" stage, and store growth cannot be directly equated to revenue realization.
Black Friday Catalyst: How Much Increment Can the E-Commerce Peak Season Bring to the Platform?
Thanksgiving in 2026 falls on November 26, Black Friday is on November 27, and Cyber Monday is on November 30, with the promotional window extending from the end of October to early December.
The impact of Black Friday varies among different advertisers. Game user acquisition follows new game releases and version updates, while the increase in user engagement during the holidays is generally offset by attention being diverted to promotions, resulting in a relatively neutral net impact. E-commerce advertisers benefit, with three main pathways: increased budgets, more advertisers competing for limited ad space driving up eCPM, and high-frequency ad placements generating a large amount of conversion data to accelerate model training.
The increase in Black Friday sales does not equate to revenue growth for AppLovin; what truly needs to be tracked is the transmission between advertising budgets, ad performance, and platform revenue. The calculations can only provide scenarios:
 The share of e-commerce in the three scenarios and the increase in budget are market observations, not company disclosures, nor predictions. Budget growth does not necessarily translate proportionally into platform revenue, and there may also be budget shifts between advertisers.
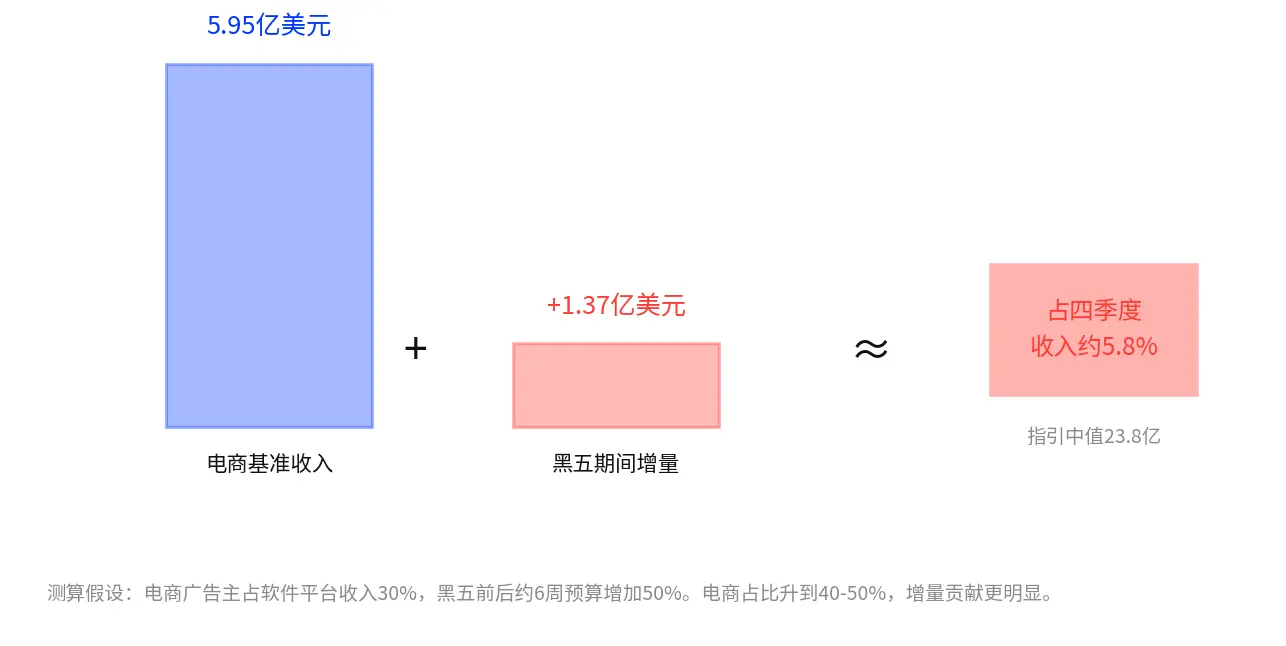
Figure 7: This chart displays the incremental contributions of the three scenarios together. The neutral scenario roughly estimates about 5.8%, providing a sense of magnitude.
The calculation for the neutral scenario is for reference only: e-commerce benchmark revenue of $1.983 billion × 30% ≈ $595 million, with an incremental $595 million × 50% × (6 weeks ÷ 13 weeks) ≈ $137 million, accounting for about 5.8% of the midpoint guidance for the fourth quarter of $2.38 billion.
Fourth Quarter Guidance: Why Does the Market Need to Focus on Sequential Growth?
Financial report data shows that revenue for Q4 2025 was $1.658 billion, with a sequential growth of 18.0%, and Q1 2026 was $1.842 billion, with a further sequential increase of 11.1%. The midpoint guidance for Q4 2026 is $2.380 billion, with a sequential growth of 8.9%, lower than the historical seasonal trends for Q4.
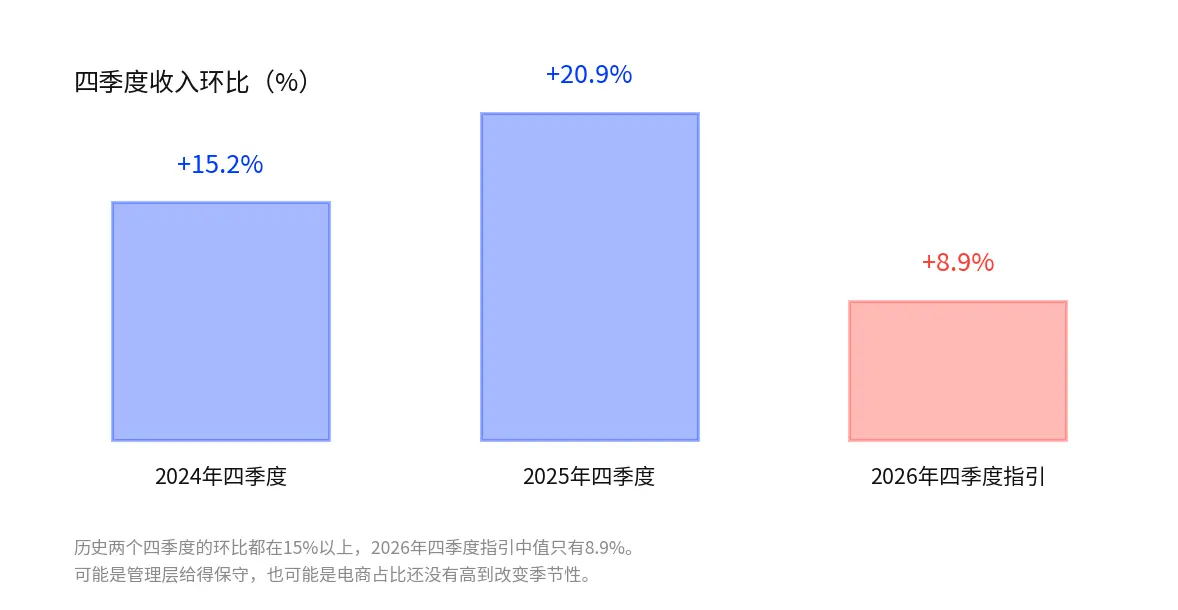
Figure 8: This chart is used to observe seasonality. The sequential growth in historical Q4s is significantly higher than the guidance of 8.9%, which may indicate that management is being conservative, or that the share of e-commerce has not yet reached a level to change seasonality.
There are two neutral interpretations for this comparison: management guidance is consistently conservative, and exceeding expectations in quarterly reports is the norm. Alternatively, the share of e-commerce has not yet reached a level to change seasonality. Which explanation holds true will be answered by Black Friday data and the quarterly report.
Whether e-commerce can take over essentially asks: Is AppLovin's high cash flow a one-time bonus from game advertising, or is it a capability that can be replicated in new scenarios? The answer to this question determines whether the 27.5 times price-to-earnings ratio is "undervalued" or "reasonable."
Whether e-commerce can take over is a question of "growth potential." However, growth potential does not equate to valuation potential; the 27.5 times price-to-earnings ratio has already factored in certain assumptions and what conditions are needed for an upward revision, which will be calculated in the next section.
### Behind the 50% Increase: Did APP's Rise Mainly Come from Earnings or Valuation Expansion?
Peer comparisons indicate that AppLovin's valuation multiple is relatively low; being low does not mean it will recover, and the catalysts for recovery are Black Friday and the quarterly report. Let's calculate.
Breaking Down the 50% Increase: How Much Did Earnings Growth Contribute?
Over the past year, rolling earnings per share rose from $8.24 to $14.91 (financial report data interface TTM basis), an increase of 80%. The closing price before the financial report was about $272, corresponding to a rolling earnings per share of $10.56, approximately 25.7 times, placing it at the cheapest position in the past eight reporting periods.
After the financial report, it rose by 50%, with $410 corresponding to the disclosed $14.91, about 27.5 times. Roughly calculated, about 80% of the 50% increase came from the uplift in rolling earnings, with the multiple only rising from 25.7 times to 27.5 times. The market adjusted AppLovin's multiple from "not believing growth can be sustained" before the financial report to "believing growth can be sustained for a while" after the report, with the adjustment not being aggressive. There is still a need for subsequent performance verification to justify a higher growth premium.
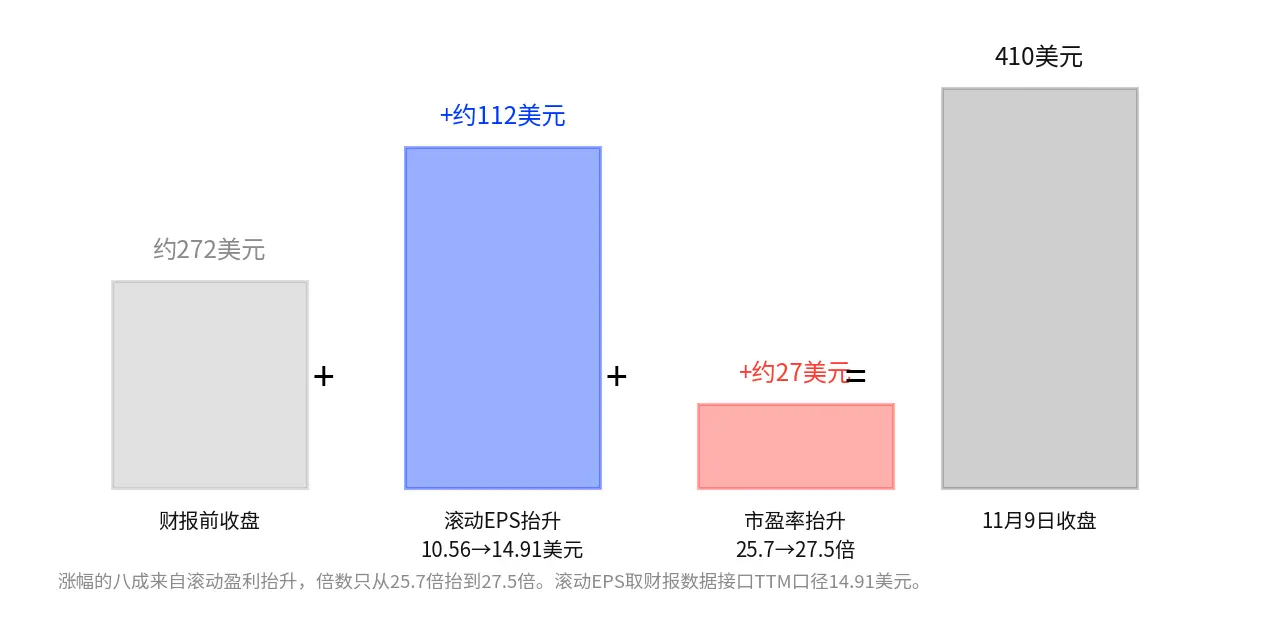
Figure 9: This chart shows the composition of the 50% increase. The uplift in rolling earnings per share contributed about $112, and the multiple uplift contributed about $27, measured in dollars.
Three Comparable Companies: Valuation Differences Among Ad Platforms, Mature Advertisers, and AI Software Companies
There are many comparable companies, but this text only retains three, each answering a different question, with metrics based on their latest reporting periods' GAAP data, and price-to-earnings ratios based on rolling metrics for comparative magnitude.
The Trade Desk: Comparison of business models for advertising technology platforms. Observing revenue growth, profit margins, and advertising budget growth. Its low net profit margin is determined by the sales model; how to interpret 120 times was discussed in the first section, and that is just one possible explanation.
Meta: Comparison of profitability for mature advertising platforms. Observing net profit margins, advertising revenue growth, and cash flow. Meta's net profit margin in Q3 was about 38%, while AppLovin's was 65.9%, with the difference stemming from AppLovin not having content costs, being a pure platform.
Palantir: Valuation comparison of AI technology commercialization. Observing revenue growth, cash flow profit margins, and valuation multiples. Palantir's Q3 revenue grew by 30% year-over-year, with a free cash flow profit margin of about 37% and a price-to-earnings ratio of about 80 times. AppLovin's revenue growth rate and cash efficiency are higher, yet its multiple is only about 27.5 times. It should be clarified that Palantir's comparability is weaker than the first two: it answers "how much premium can AI tags provide," not "what is a reasonable multiple for advertising platforms," and is included here only as a side reference.
Three Valuation Scenarios: After E-commerce Realizes, What Assumptions Are Implicit in Market Pricing?
The unified framework is "earnings growth × reasonable valuation multiple." The current TTM price-to-earnings ratio is about 27.5 times, and the market may be factoring in the following risks: growth significantly slowing in the next 12-18 months, e-commerce business diluting profit margins, and competition compressing the upward space for eCPM.
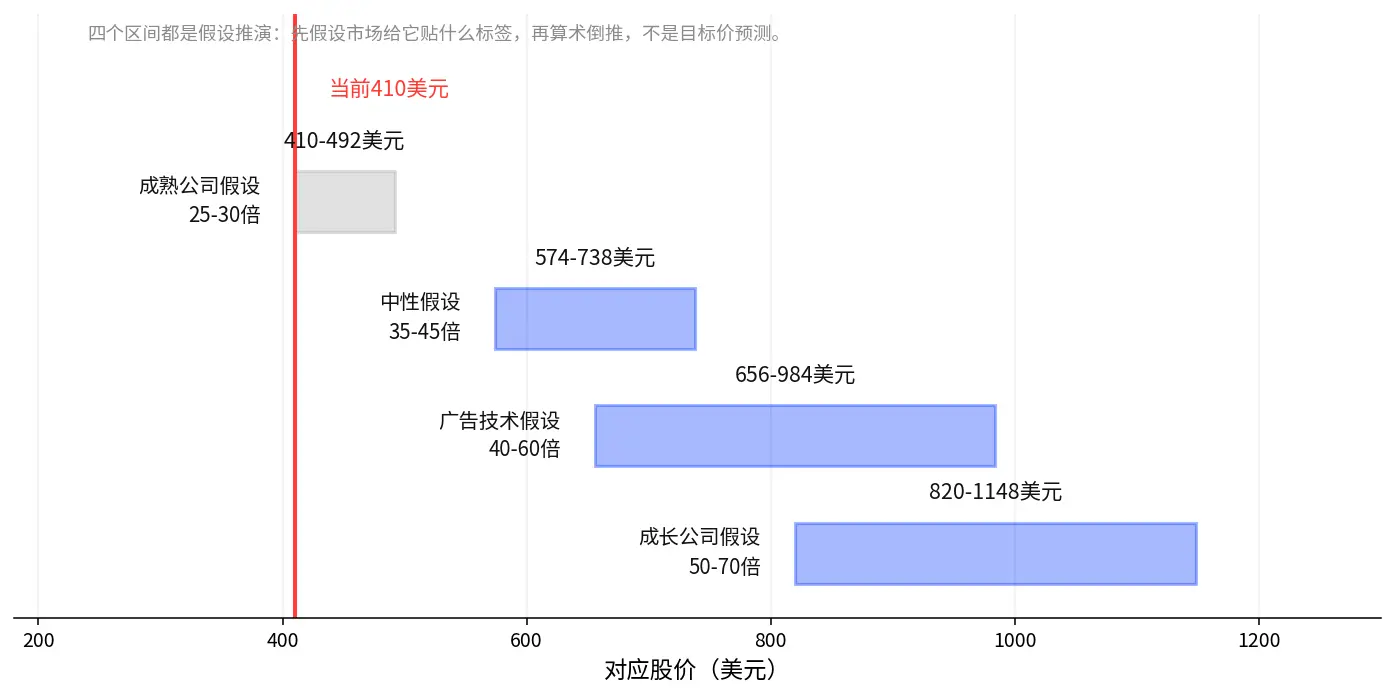
Figure 10: This chart displays the assumed price-to-earnings ratio ranges for the three scenarios together, with the dashed line indicating the current position of about 27.5 times. This article does not provide specific price ranges; readers can multiply their own EPS assumptions by the ranges to deduce what level of earnings realization is needed for each scenario.
Neutral Scenario: Game advertising remains stable, e-commerce gradually contributes, growth rate normalizes to 25-30%, and profit margins remain high, referencing 28-35 times, currently around 27.5 times.
Optimistic Scenario: E-commerce is validated as a second growth curve, with profit growth maintaining around 40%, free cash flow matching net profit, and the market possibly granting a growth premium, referencing 38-48 times. The premise for the premium is multi-quarter validation.
Cautious Scenario: E-commerce expansion does not meet expectations, with profit growth falling below 10%, referencing 20-25 times. If growth falls short of expectations, valuation compression may amplify stock price volatility.
Under the premise of sustained growth, there is potential for a reassessment of current valuations. The validity of this observation hinges on positive verification from e-commerce data in the quarterly report.
### After a 50% Increase, What Valuation Risks Does APP Still Face?
First, distinguish between two categories. The first four are business risks stemming from AppLovin itself. The fifth is a market risk stemming from pricing.
Risk Overview:
E-commerce expansion does not meet expectations. The second growth curve may not be able to take over, which is the pivot point for all observations in this text, and will be elaborated on separately.
Intensified competition in advertising algorithms. Data advantages may not be sustainable long-term; focus should be on eCPM, advertiser ROI, and market share.
Changes in platform and privacy policies. Ad attribution and data acquisition may be affected; focus should be on iOS, Android, and related regulatory policies.
Rising costs. Cloud service and model costs may erode profit margins; focus should be on operating expense ratios, cloud service costs, and free cash flow.
Valuation pullback (market risk). After the stock price rises, the market demands higher growth realization; focus should be on EPS expectations, price-to-earnings ratios, trading volume, and volatility.
E-commerce Expansion Not Meeting Expectations: The Second Growth Curve May Not Be Able to Take Over
E-commerce is the weakest link in all observations and the pivot point for all observations in this text. The conversion path for game user acquisition is short, with downloads to payment typically completed within 7 days, and attribution is closed-loop. E-commerce advertising must go through multiple stages of clicking, browsing, adding to cart, and payment, making attribution difficult. The predictive accuracy of models in the e-commerce scenario determines whether advertisers are willing to continue increasing budgets. The weekly growth rate of the number of stores is merely a leading indicator of client onboarding; onboarding does not equate to ad placements, and ad placements do not equate to revenue, with a time lag in budget realization in between. If the predictive accuracy of models in the e-commerce scenario cannot keep up, the data flywheel will slow down, and the weekly growth rate of the number of stores is the first alarm. If this fails, the second growth curve cannot take over, and the multiple assumptions in the optimistic scenario lose their pivot.
The Other Three Business Risks: Different Natures, But All Need Monitoring
These three risks have different natures; the first two are changes in the external environment, while the third is an internal cost structure change. They do not serve as the pivot point for all observations like e-commerce, but all need monitoring.
The competition in algorithms has three data barriers: over 10 years of full-link delivery data, the scale of a bilateral network, and the switching costs for advertisers. However, all three barriers share a common premise: the data from e-commerce advertisers can sustain the flywheel of game advertisers. The net profit margin has generally been between 44%-67% over the past eight quarters, with a drop to 59.5% in Q3 2025; seven quarters of data are insufficient to prove that the profit margin has entered a long-term stable range, and future observations of competition, advertising budgets, and technology costs are still needed.
Regarding privacy policies, AppLovin's advertising platform business does not operate in a completely independent environment. The iOS ATT (App Tracking Transparency) framework and potential future privacy restrictions will directly affect ad attribution and data acquisition, thereby impacting model effectiveness and advertiser returns. Changes in mobile ecosystem rules are not controlled by AppLovin.
On the cost front, cloud service fees and model costs increase with business expansion, which will simultaneously compress profit margins and free cash flow. This is precisely where the "light capital expenditure pressure" mentioned in the first section needs to be discounted. On the valuation side, if growth does not meet expectations, valuation compression may amplify stock price volatility, and the process of the price-to-earnings ratio returning from 27.5 times to a cautious range may be more painful than the process of rising.
Using several "control groups" for reflection, let's roughly compare:
Storage Chips: Companies like Micron and SanDisk have cyclical profits; when prices drop, profits follow and fall quickly. Their significant drop on November 5 is an example of "product prices falling ahead of profits." AppLovin is different; its net profit margin fluctuates at a high level and is not a business that collapses when cyclical prices crash.
CoreWeave: Also tagged as AI, its revenue growth is faster, but its expansion relies on borrowed money. As of the end of Q2 2026, it had interest-bearing debt of $51.6 billion, with quarterly interest expenses of about $640 million, while the adjusted operating profit during the same period was only $128 million—indicating that interest expenses are significantly higher than operating profit. It dropped 9.83% on November 5. This is a mirror image of "high-leverage computing assets."
AppLovin: As of the end of Q3 2026, total debt was about $3.52 billion, while rolling operating cash flow was about $4.9 billion, meaning that less than a year’s operating cash flow can cover total debt. The balance sheet structure is completely different from CoreWeave.
Therefore, when observing leverage risk, do not just look at the size of the debt; the key is to focus on one ratio: interest expenses ÷ operating profit. The burden of interest should be assessed based on the interest expense figures in the financial report.
Five, Black Friday to Quarterly Reports: What signals will change market observations in the next three months?
After completing the observations, the remaining question is what to focus on in the next three months and when to change the narrative. The observations can be divided into three segments.
Short-term: Will funds continue to recognize APP's cash flow logic?
After a 50% surge post-earnings, the short-term observation is whether the repricing has sustainability. Look for four indicators: whether the price increase is accompanied by increased trading volume, whether it can maintain relative strength during pullbacks, whether market risk appetite for AI advertising and software platforms has improved, and the relative performance of APP against advertising stocks like Meta and TTD.
Increased trading volume alone is not a buy signal; it must be observed in conjunction with price direction, volatility, and market conditions.
Mid-term: After Black Friday, will e-commerce advertising budgets truly materialize?
From late November to early December, the sales data from Black Friday and Cyber Monday serves as the first layer of signals. From December to January, whether the growth rate of Store Leads' store count accelerates is the second layer. The third layer involves whether advertisers are increasing budgets and whether eCPM and conversion rates are improving. All three layers must trend upwards for e-commerce validation to be considered complete.
Long-term: Can Q4 performance and Q1 2027 guidance support valuations?
What truly determines valuation is never just the single-day sales data from Black Friday; the decisive factors are the realization of Q4 performance and the guidance for Q1 2027.

If revenue falls above the upper limit of guidance, it will strengthen growth observations, but it still needs to be validated against e-commerce business data. A drop in Q4 net profit margin to 62%-63% (research observation threshold, set by the author, not company guidance) may indicate that e-commerce business is diluting profit margins. If Q1 guidance is flat or grows quarter-on-quarter, it indicates that e-commerce has changed its seasonality. A quarter-on-quarter decline exceeding 10% (research observation threshold, set by the author) would suggest that the acceleration in Q4 might be one-time.
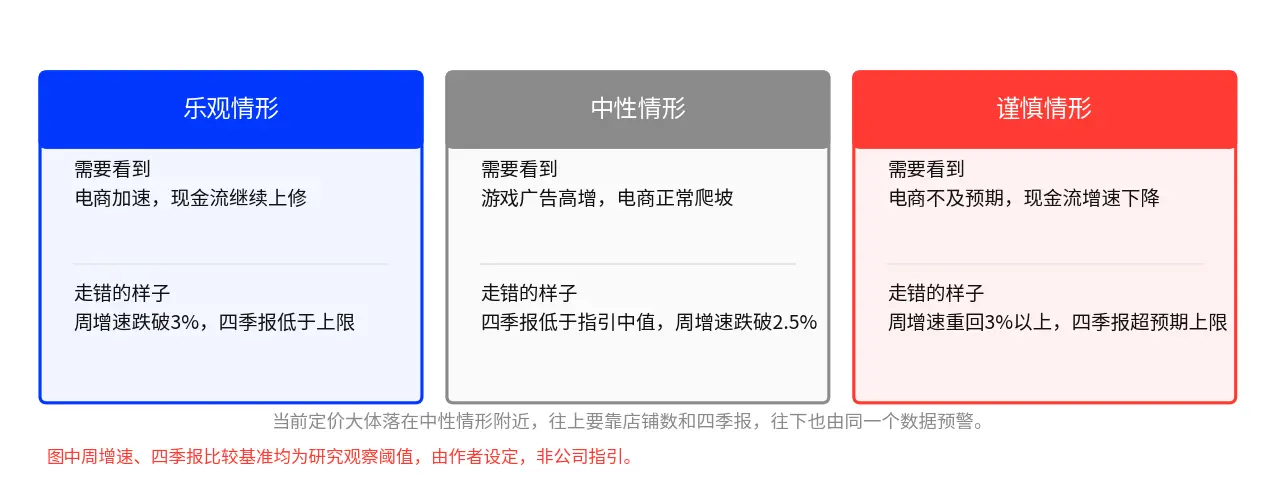
Figure 11: This chart lists the triggering conditions and warning signals for three different paths, with values noted as research observation thresholds. The current pricing is generally near a neutral scenario.
Expectation Gap: Why might stock prices still fall despite good performance?
The key to stock trading is not just whether company performance is good; it hinges on how actual results compare to market expectations. A 55% revenue growth is impressive, but has the market already anticipated even higher? A weekly store count growth of 3.1%, has that already been reflected in the stock price? Exceeding expectations in Black Friday sales, does that necessarily mean AppLovin's revenue will also exceed expectations? If the financial report reaches the upper limit of guidance, will the market be disappointed due to a lack of further upward revisions? The answers to these questions determine the stock price direction following the same financial report.
Logic Failure: What signals indicate a need to reassess observations?
If AppLovin's free cash flow growth lags significantly behind profit growth for two consecutive quarters, or if the market assigns a higher multiple to loss-making, expanding computing assets while platforms with ample cash are discounted, it indicates that the differentiation observed on November 5 was merely a one-day fluctuation, and the observations throughout this article need to be overturned.
Six, From APP to META and TTD: What other observation targets exist in the AI advertising industry chain?
AppLovin is not an isolated case. In the advertising industry chain, first look at three core companies, then expand outward to cover more segments of the same budget cycle.
Core Three: Three Positions in the Same Budget Cycle
AppLovin: AI-driven advertising bidding optimization. Monitor e-commerce advertising growth, profit margins, and cash flow.
Meta: Advertising budgets and AI recommendation efficiency. Monitor advertising revenue, advertising prices, and AI return on investment.
The Trade Desk: Programmatic advertising market. Monitor advertising budgets, customer retention, and revenue growth.
The interconnection among these three is directional: if AppLovin's e-commerce business continues to exceed expectations, the market may increase its focus on AI advertising technology platforms. If Meta's advertising revenue and advertising prices improve simultaneously, it indicates that advertiser budgets and industry demand remain healthy. If TTD's revenue growth recovers, it may reflect an improvement in programmatic advertising demand.
Expanded Observations: Three "Budget Flow" Questions, Each with an Executable Inquiry Method
The following market capitalizations are based on the closing snapshot of U.S. stocks on November 12, 2026. The expanded targets are not detailed individually but compressed into three questions based on budget flow, with each question providing what to look for, where to check, and what situation counts as a trigger.
Is the total budget large enough? Google's search advertising and Amazon's retail media advertising are upstream levels for AppLovin's e-commerce expansion. If Google's search advertising growth slows down and Amazon's retail media revenue accelerates, it indicates that e-commerce budgets are concentrating towards retail media, and the budget pool AppLovin aims to capture may be smaller than expected. Inquiry method: Review the advertising segment revenue in the quarterly reports of both companies, updated with each earnings season, and observe the direction of year-on-year growth.
Is the budget migrating to new platforms? Criteo and PubMatic represent the old generation of e-commerce advertising technology and programmatic supply side. If Criteo's customer retention declines and PubMatic's transaction volume stagnates while AppLovin's store count increases, it indicates that budgets are migrating from old platforms to AI bidding platforms, and this migration speed may better illustrate the situation than AppLovin's own growth rate. Inquiry method: Review Criteo's customer retention rates and guidance from their financial reports, and PubMatic's transaction volume metrics quarterly, comparing them with Store Leads' weekly data.
Is the budget from old scenarios flowing back? Unity and Pinquzhi serve as a contrasting group for game user acquisition and e-commerce seeding. If Unity's advertising business recovers, it indicates that game user acquisition budgets are flowing back, increasing competitive pressure on AppLovin's gaming side. If Pinquzhi's e-commerce functionalities progress slowly, it indicates that e-commerce budgets are increasingly dependent on AI bidding platforms. Inquiry method: Review Unity's disclosed advertising business revenue and Pinquzhi's advertising revenue growth rates along with announcements on e-commerce functionality progress quarterly.
The nine targets belong to five segments: advertising demand, advertising technology, programmatic platforms, retail media, and creative engines. Viewing them together establishes an observation framework: the total budget is assessed through Google and Amazon, budget redistribution is observed through APP, TTD, Criteo, PubMatic, and Unity, and budget conversion effectiveness is evaluated through Meta and Pinquzhi. The selection of individual stocks depends on their respective situations.
Conclusion: The AI trend is not over; the market is beginning to demand growth to demonstrate cash flow proof
The AI trend is not over. The term rotation is inaccurate; what is more worth observing is that the market is changing its measuring stick: from "whose growth story is bigger" to "whose growth can turn into cash." In the past, there was a greater willingness to pay for potential future growth; now there is a demand for that growth to provide cash flow proof.
AppLovin has already demonstrated the profitability quality of its current business through cash flow, but the future valuation space has not been fully proven; e-commerce advertising and the Q4 report in February 2027 are the key verification points. The financial report needs to answer four questions that night: Has profit turned into cash? Who is funding the growth? Is profit stable? Can it sustain itself in the next round? The answers to these four questions will clarify the quality of this financial report.
Judgments can be revised. A 50% increase in three days has widened the price gap between "real cash flow" and "tagged growth," but whether this gap can be maintained does not depend on November 5; it depends on the four answers in the next three months. If three of the four answers are affirmative, then this gap is real. If two or more are negative, it is merely a one-time sentiment following the financial report.
Disclaimer: The content of this article is for general information and market commentary purposes only, compiled based on publicly available information as of the time mentioned in the text. Relevant market data, expectations, and probabilities may change with market conditions. The views and investment strategies cited from third-party institutions, analysts, or other individuals only represent the views of the relevant third parties at a specific time. This article does not constitute investment advice, investment research, an invitation, solicitation, or recommendation for any securities, investment products, or trading strategies, nor should it be used as a basis for any investment decisions. Financial markets carry risks, and securities prices and market performance may fluctuate; past performance and historical market trends do not represent or guarantee future results. Investors should independently assess relevant risks based on their own circumstances and seek professional advice when needed.
 Risk warning Risk warning




Popular articles