Delphi Digital researcher: How to determine if a project is truly undervalued?
 Core Viewpoint

 A low xRev does not necessarily mean that a project is undervalued; it may also indicate that the market is pricing in a decline in revenue. Through PUMP and AERO, this article analyzes how to determine whether a project is truly cheap or if its fundamentals are deteriorating.
Author: Marcus (@that1618guy), Delphi Digital Researcher
Compiled by: Jiahua, ChainCatcher
When filtering projects, there is a question I have been pondering repeatedly: If a project's revenue can cover its current market value in less than two years, why are you still unwilling to buy it?
The answer is almost never the revenue itself, but whether you believe that this revenue can be sustained.
This is the xRev multiple, market capitalization divided by annualized revenue, which truly measures something. It’s not about how cheap it is, but about sustainability.
Two ongoing cases illustrate this point well. PUMP and AERO, based on past revenue, are both at low single-digit multiples, 2.3 times and 3.5 times respectively. However, in the past 30 days, PUMP has risen by 87%, while AERO has fallen by 14.5%.
The same filtering results, yet completely opposite trends.
In June of this year, the market only gave PUMP a valuation of 1.3 times, which means the market did not even believe that this agreement could maintain its current revenue for more than 16 months. By July, this skepticism began to crumble, and the subsequent rise was almost entirely due to a revaluation.
AERO, on the other hand, is exactly the opposite. Since its price peaked in December 2024, its multiple has nearly doubled, not because the market has become more confident in it, but because the speed of revenue decline has outpaced the speed of market repricing.
If this framework holds, then the trading logic is not "buy at the lowest multiple." Instead, it is "buy the multiple that is about to no longer be doubted by the market." When a previously doubted revenue source proves it can be sustained, even if the market capitalization rises faster than revenue growth, the revaluation itself can account for most of the increase.
What xRev Truly Measures
xRev is simple: market capitalization divided by annualized revenue. When xRev is 1.0, it means the revenue for one year is equivalent to its entire market value. Below 1.0 means it takes less than a year.
When seeing such numbers, the first reaction is often that the market has mispriced it. But a more accurate understanding is that the market is applying a significant discount for the sustainability of this revenue. The market is essentially telling you: it believes this revenue is just a temporary phenomenon, will decline afterward, and will not recover.
Therefore, an extremely low xRev is not a buy signal; it is more like a way for the market to express skepticism. The real Alpha lies in judging whether this skepticism is right or wrong.
Before entering the case studies, it is necessary to make a distinction, as the initial xRev level of a token determines what type of trading opportunity it may evolve into later. They can be divided into two categories.
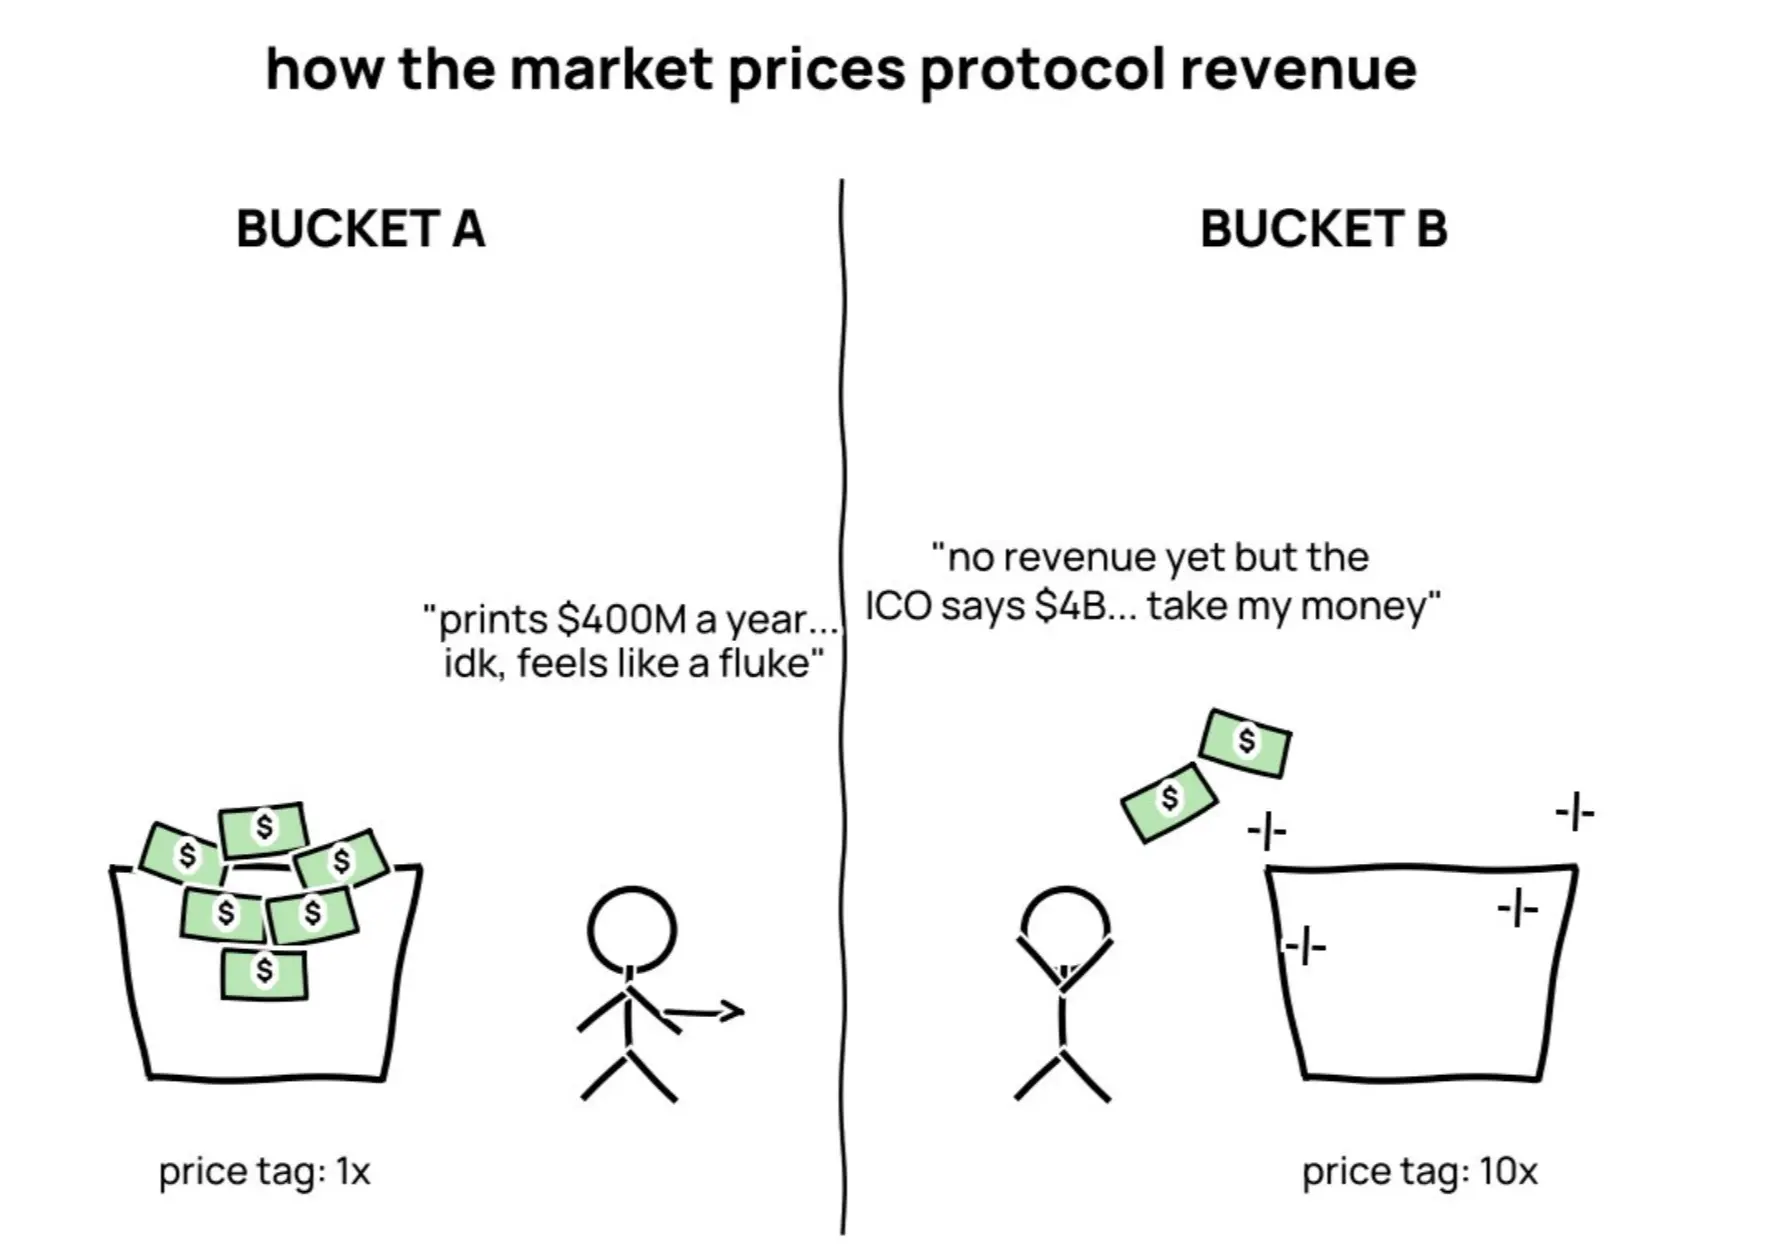
Category A tokens are inherently cheap: a new protocol finds product-market fit in a high-fee lane, and revenue explodes rapidly, but the market does not yet believe this revenue can be sustained, so xRev starts around 1 times or even below 1 times. High revenue, small market cap, and extreme market skepticism. The only reason their market cap is low is that the market has not yet believed in their revenue story. Therefore, these tokens are most likely to become candidates for "belief revaluation."
Category B tokens are inherently expensive: from day one, the market prices them as future revenue giants, so xRev starts high, with all optimistic expectations already priced in. There is no "skepticism" here that allows you to buy; you can only wait for the project to fulfill the expectations that the market has already paid for in advance.
AERO undoubtedly belonged to Category A at launch. PUMP, on the other hand, undoubtedly belonged to Category B. Let’s see what happened to each of them.
Pump: Category B Project Begins to Realize Previous Premium
PUMP is a typical Category B case.
PUMP issued tokens after a $1 billion financing round, with a corresponding diluted valuation of $4 billion, equivalent to more than 9 years of the protocol's revenue at that time; based on circulating market cap, the opening xRev reached 4.5 times.
The market paid a premium in advance for belief. Over the next year, the market has been pulling back this premium.
At the time, this was not difficult to understand. Meme coin trading volumes are cyclical, competitors have been vying for order flow, and no one could be sure whether this platform could maintain its market share.
From the xRev chart, it is very clear to see how this pre-priced belief gradually disappeared. For a full 11 months, xRev was almost continuously compressed, while the protocol still generated over $200 million in total revenue each quarter.
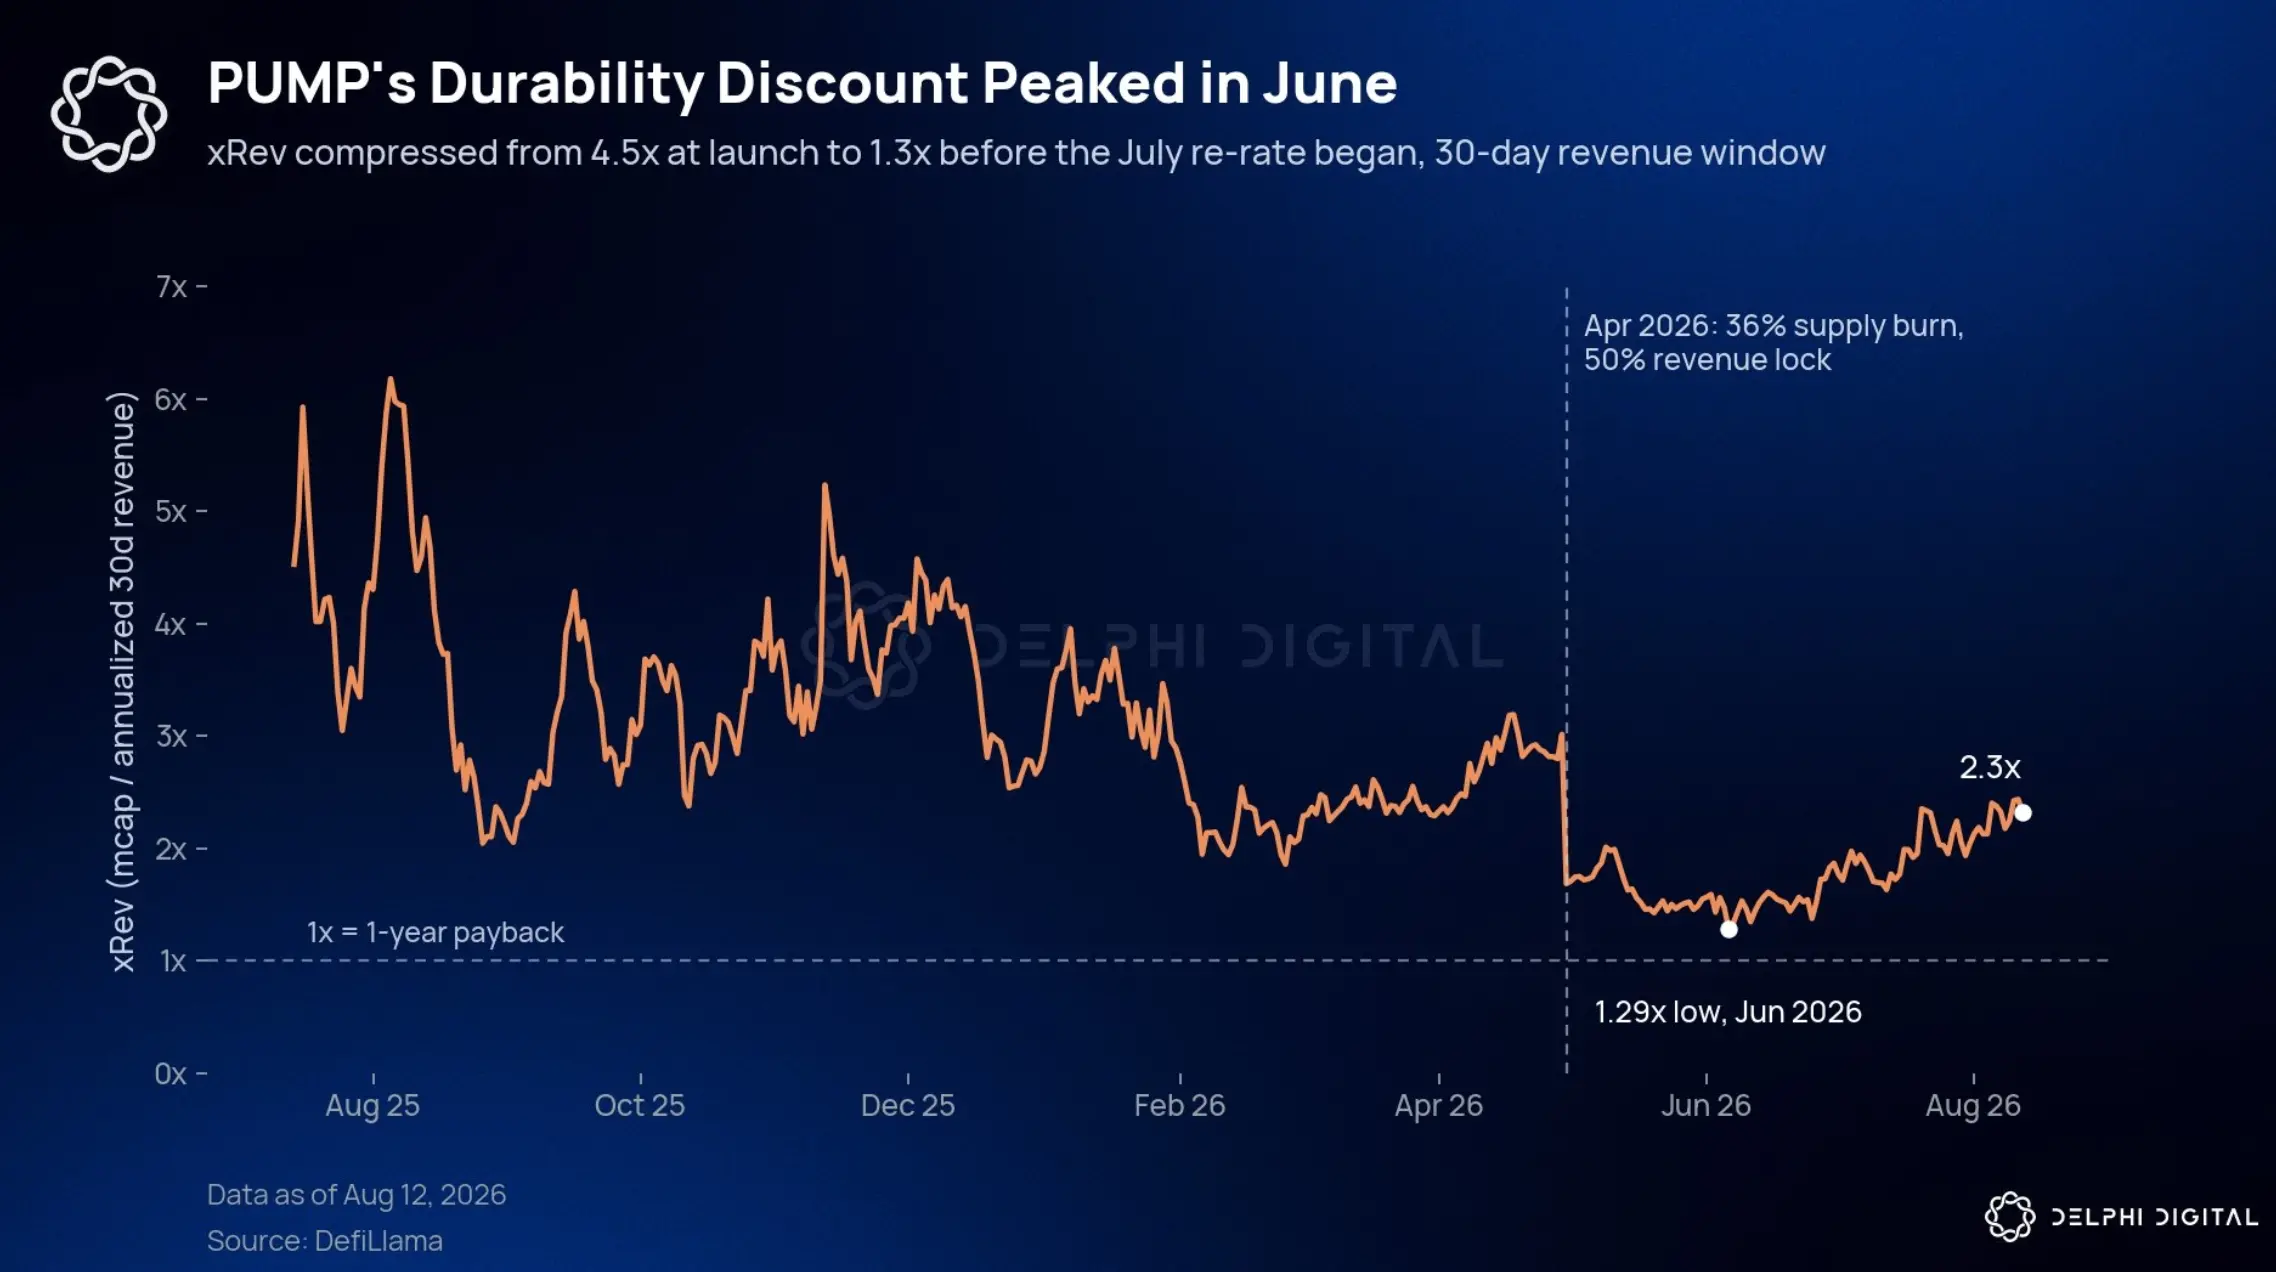
Figure 1: PUMP's xRev since token issuance, using a 30-day revenue window.
There are two things particularly worth noting in this chart.
First, the restructuring in April 2026 brought a mechanical xRev adjustment, not just a change in market sentiment.
Pump burned all previously repurchased tokens, with a total value of about $370 million, accounting for 36% of the circulating supply at that time. Subsequently, the protocol locked 50% of its net revenue into an irrevocable repurchase and burn contract, which will last for one year.
This destruction removed about one-third of the circulating market cap overnight, so from a calculation standpoint, xRev must have immediately decreased.
But what is truly noteworthy is that even so, the market continued to discount.
After the burn, xRev fell from about 1.7 times all the way down to 1.29 times on June 6. At this price, PUMP's market cap was even less than its 16 months of revenue, and half of that revenue was already contractually determined to be used for purchasing and burning PUMP.
This is what it looks like when market skepticism peaks.
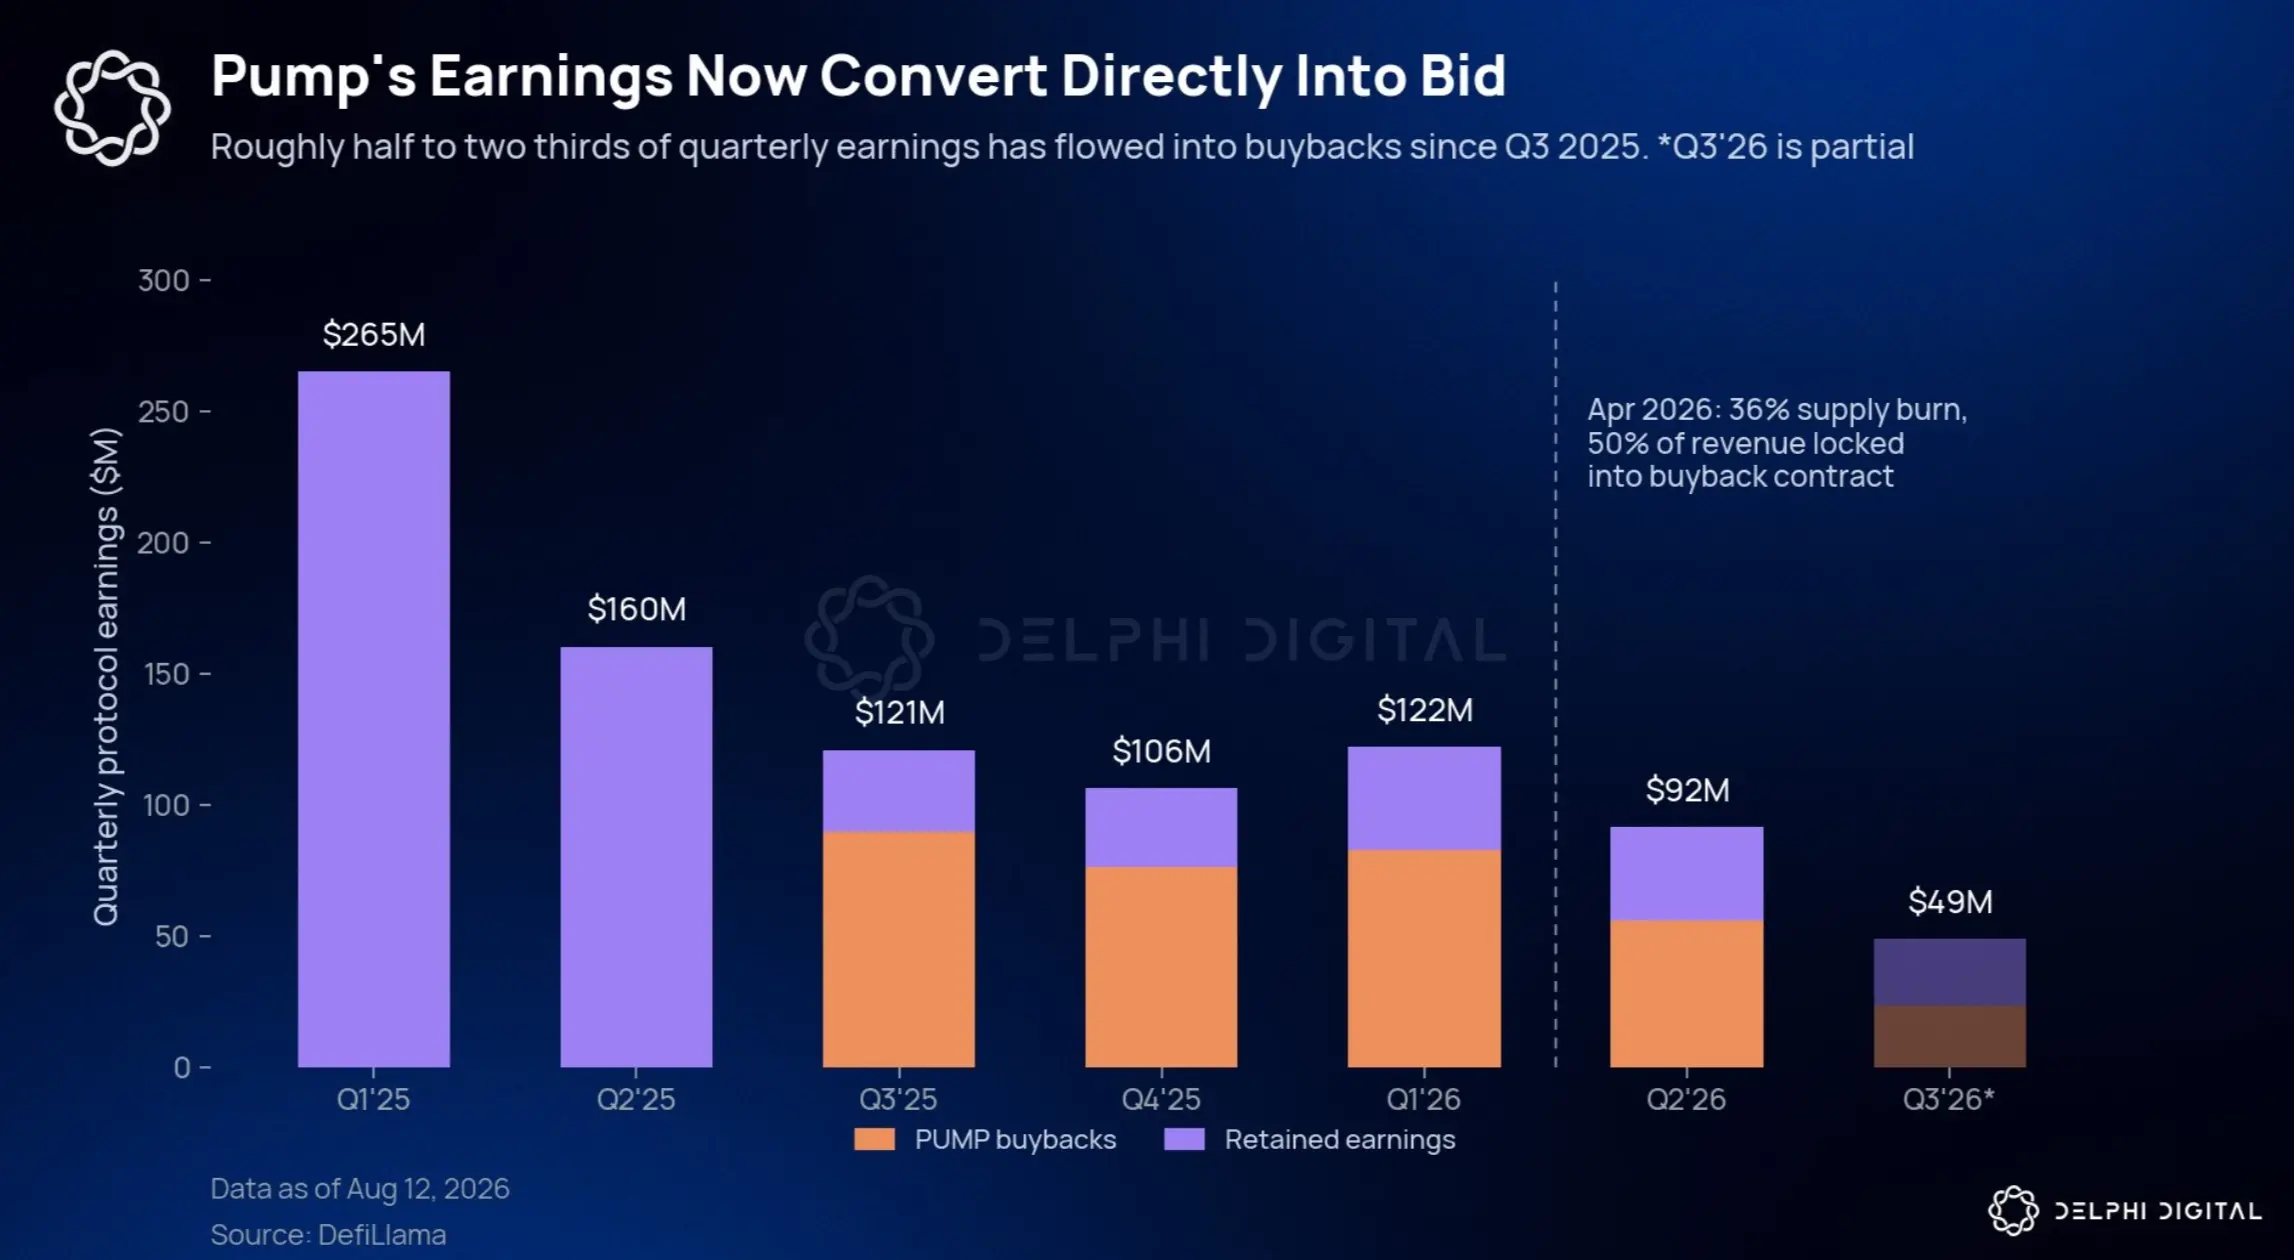
Figure 2: Pump's quarterly protocol revenue, with the portion used for repurchase marked.
Second, only when the revenue story begins to change does the valuation revaluation truly kick off.
The week from August 3 to 9 was the first time in Pump's history that weekly fees exceeded $10 million, of which $5.02 million was used to purchase and burn 2.15 billion PUMP.
The revenue for the past 30 days reached $37.9 million, corresponding to an annualized approximately $460 million, while the revenue for the past 12 months was $457 million. The current operating speed is almost completely consistent with the past year's level, and cumulative protocol revenue has also surpassed $1.2 billion.
The market took a year to determine that this revenue was just a coincidence, but it not only still exists but is also turning upward again.
What was the result?
xRev has expanded by about 80% from the low of 1.29 times on June 1, reaching 2.3 times, while pushing PUMP up by 87% in the past 30 days, with a circulating market cap of $1.07 billion. This does not require explosive revenue growth.
Most of the gains in this round of market are essentially from the market reassessing the sustainability of the revenue. More and more people began to believe that at the current revenue level, the revenue generated in about 2.3 years is equivalent to the current market cap, so they are willing to pay a higher price. Even if revenue remains unchanged, this will push xRev up.
So my point is that the real changing variable is not revenue, but the market's belief in this revenue. Of course, it must be noted that I am using circulating market cap.
If calculated based on fully diluted valuation, PUMP's FDV is $2.3 billion, corresponding to an xRev of about 5 times, and the token unlock in August is continuously narrowing the gap between these two numbers. Moreover, regardless of how the repurchase contract is designed, the revenue of the meme coin issuance platform remains cyclical.
If weekly fees fall back below the $5 million to $6 million range that has been maintained throughout the summer's fluctuations, then this valuation revaluation could also quickly reverse, just as it formed.
Aerodrome: When Low Multiples Are Actually Telling the Truth
AERO is exactly the opposite case.
On paper, AERO seems like a more attractive deal.
With a market cap of $404 million, corresponding to $116 million in annualized revenue over the past 12 months, its xRev is only 3.5 times. Moreover, unlike the vast majority of protocols, 100% of AERO's revenue flows to veAERO stakers. Real earnings, no value leakage, and 54% of the supply is locked.
It sounds like a good buying opportunity. But the xRev chart will tell you why it should not be bought now, at least for the time being.
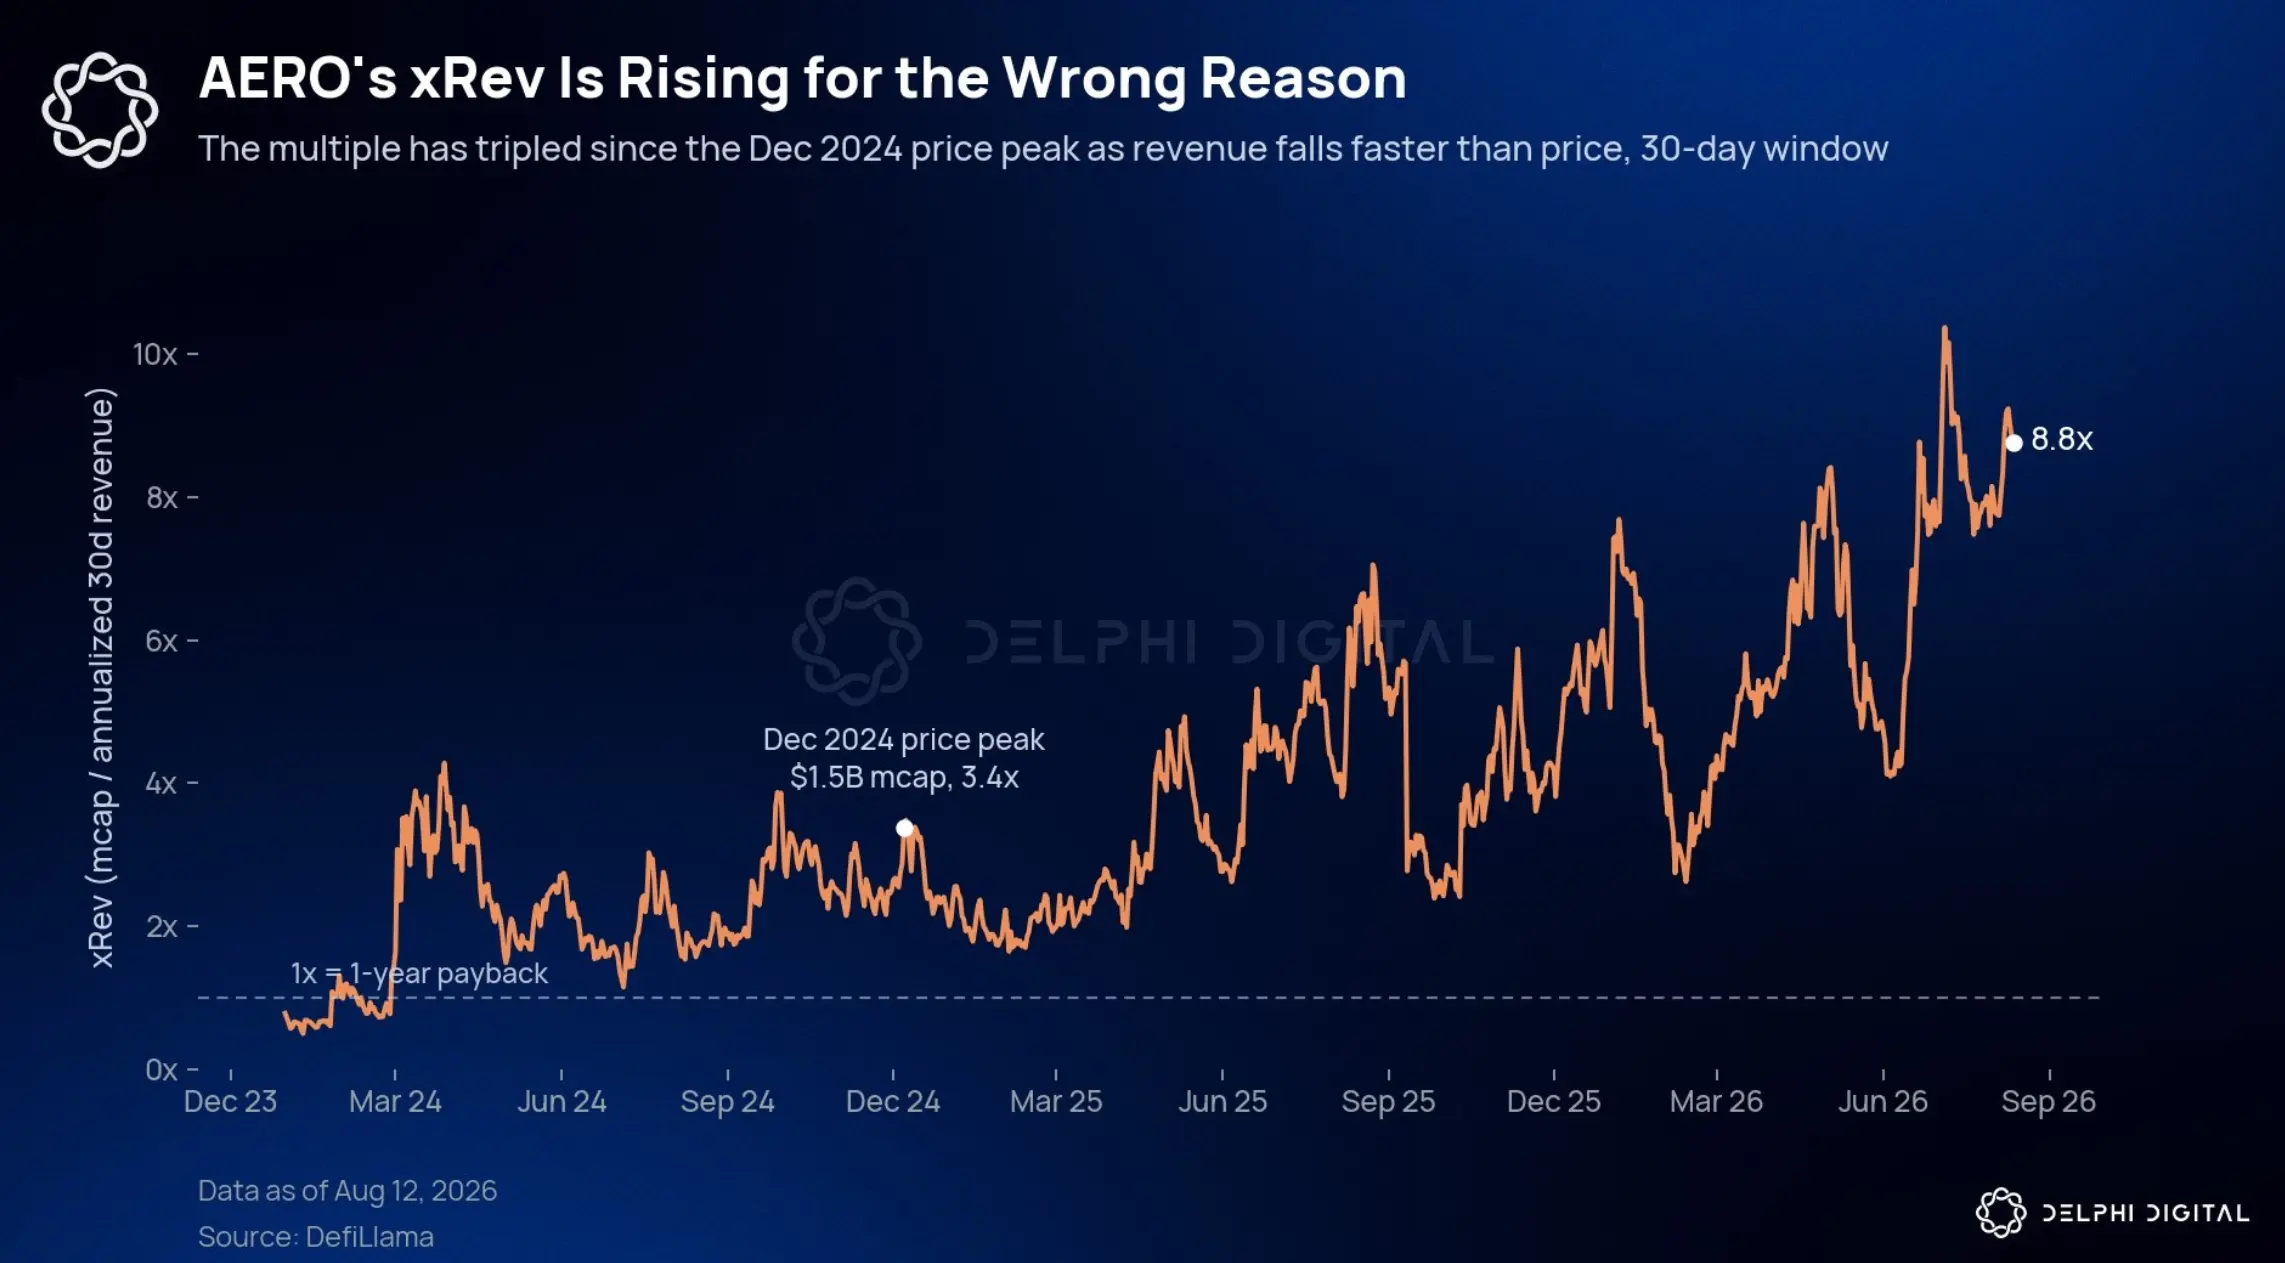
Figure 3: AERO's xRev since January 2024, using a 30-day revenue window.
At the beginning of 2024, AERO was the most typical Category A project and the best bullish case for the entire framework. It was a new protocol that had just found product-market fit, and after riding the wave of explosive growth on Base, its revenue grew rapidly, far outpacing market confidence.
At one point, the market gave it a valuation of less than 1 times, which is less than a year’s revenue. This time, the market's skepticism was wrong.
Revenue continued to grow, and market confidence followed suit. By the time the price peaked in December 2024, xRev had expanded to 3.4 times, with a market cap of $1.5 billion.
The real trading opportunity was to buy AERO when it was below 1 times xRev and then hold until the market's belief changed.
But let’s see what happened afterward.
Since that peak, the token price has fallen by 73%, while xRev has nearly doubled to 8.8 times. This combination can only occur in one way: the speed of revenue decline has outpaced the speed of price decline.
AERO's annualized instant revenue has dropped from a peak of about $443 million to about $46 million now. The total quarterly protocol revenue peaked at $106 million in Q4 2024, but by Q2 2026, it was only $29.3 million, a decline of 72%.
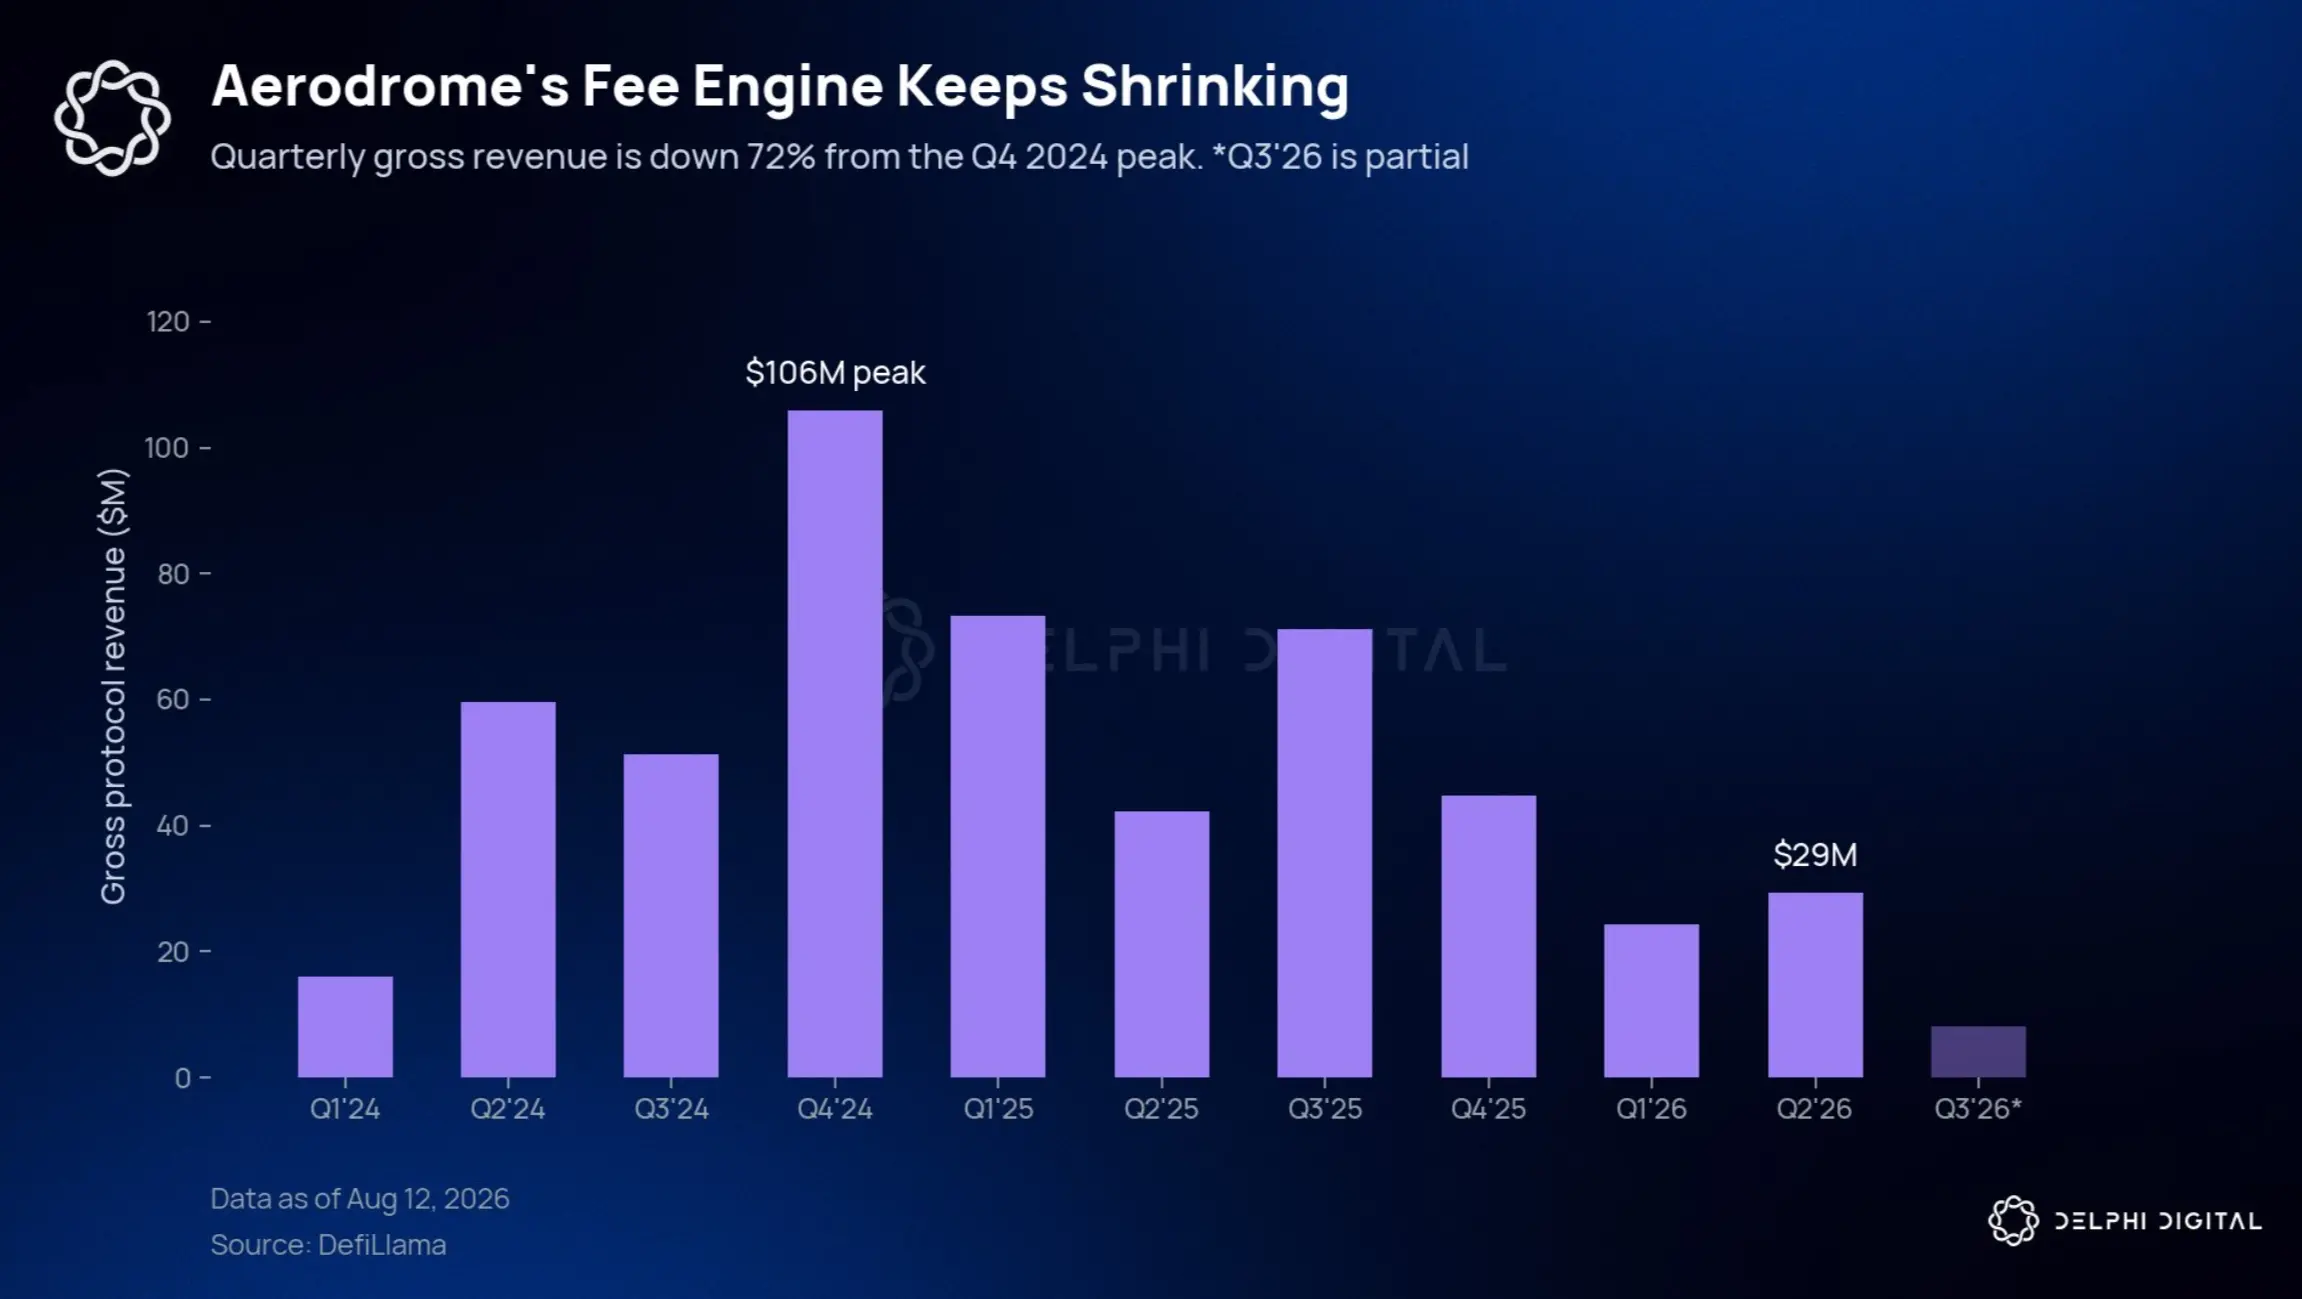
Figure 4: Aerodrome's quarterly total protocol revenue.
This is the opposite of the Pump case.
The sharp drop in AERO's price is not the market irrationally undervaluing a high-profit protocol.
In my view, the market is actually pricing a continuously declining revenue curve correctly; it’s just that the speed of price adjustment has not kept up with the speed of revenue deterioration.
In the past 30 days, AERO has fallen by 14.5%, while the market has pushed PUMP up by 87%. This is precisely the "revenue sustainability discount" mentioned earlier at work. Of course, to be fair to AERO, there are currently several potential catalysts that could change the situation, including the merger with Velodrome, the predictive allocation upgrade launched in July, and the listing on Binance.
Any one of these factors could reverse the revenue trend. If the revenue growth speed turns upward again, then the same valuation revaluation mechanism that drove PUMP's rise could also reappear, which had previously occurred with AERO itself in 2024.
But this is precisely the point.
If you buy AERO now, you are really betting on a change in the revenue trend, not just that the multiple looks cheap based on the past 12 months.
So, Under What Circumstances is xRev Considered Reasonable?
xRev is a ratio, so looking at it rising or falling alone does not explain much.
Every change can be precisely broken down into two parts: from a logarithmic change perspective, the change in xRev = change in market cap - change in revenue.
Multiple compression may mean that the speed of price decline exceeds revenue, or it may mean that the speed of revenue growth exceeds price. Multiple expansion may mean that the speed of price increase exceeds revenue, or it may mean that revenue is declining, but the price is declining more slowly.
The same chart shape may correspond to completely opposite trading opportunities.
Therefore, before interpreting any change in xRev, we should first ask: which leg is driving it? This breakdown also gives "reasonable valuation" a more empirical definition.
When both market cap and revenue are changing, but xRev remains stable over the long term, a protocol can be considered to be trading at its reasonable multiple. This means the market is repricing the token one-to-one according to changes in fundamentals.
And the multiple that the market ultimately stabilizes at during this phase is its valuation of the protocol's revenue sustainability. By observing the degree to which the price deviates from this level, we can further judge where the signals lie.
Below is AERO's xRev chart, with its history divided into three continuous phases.
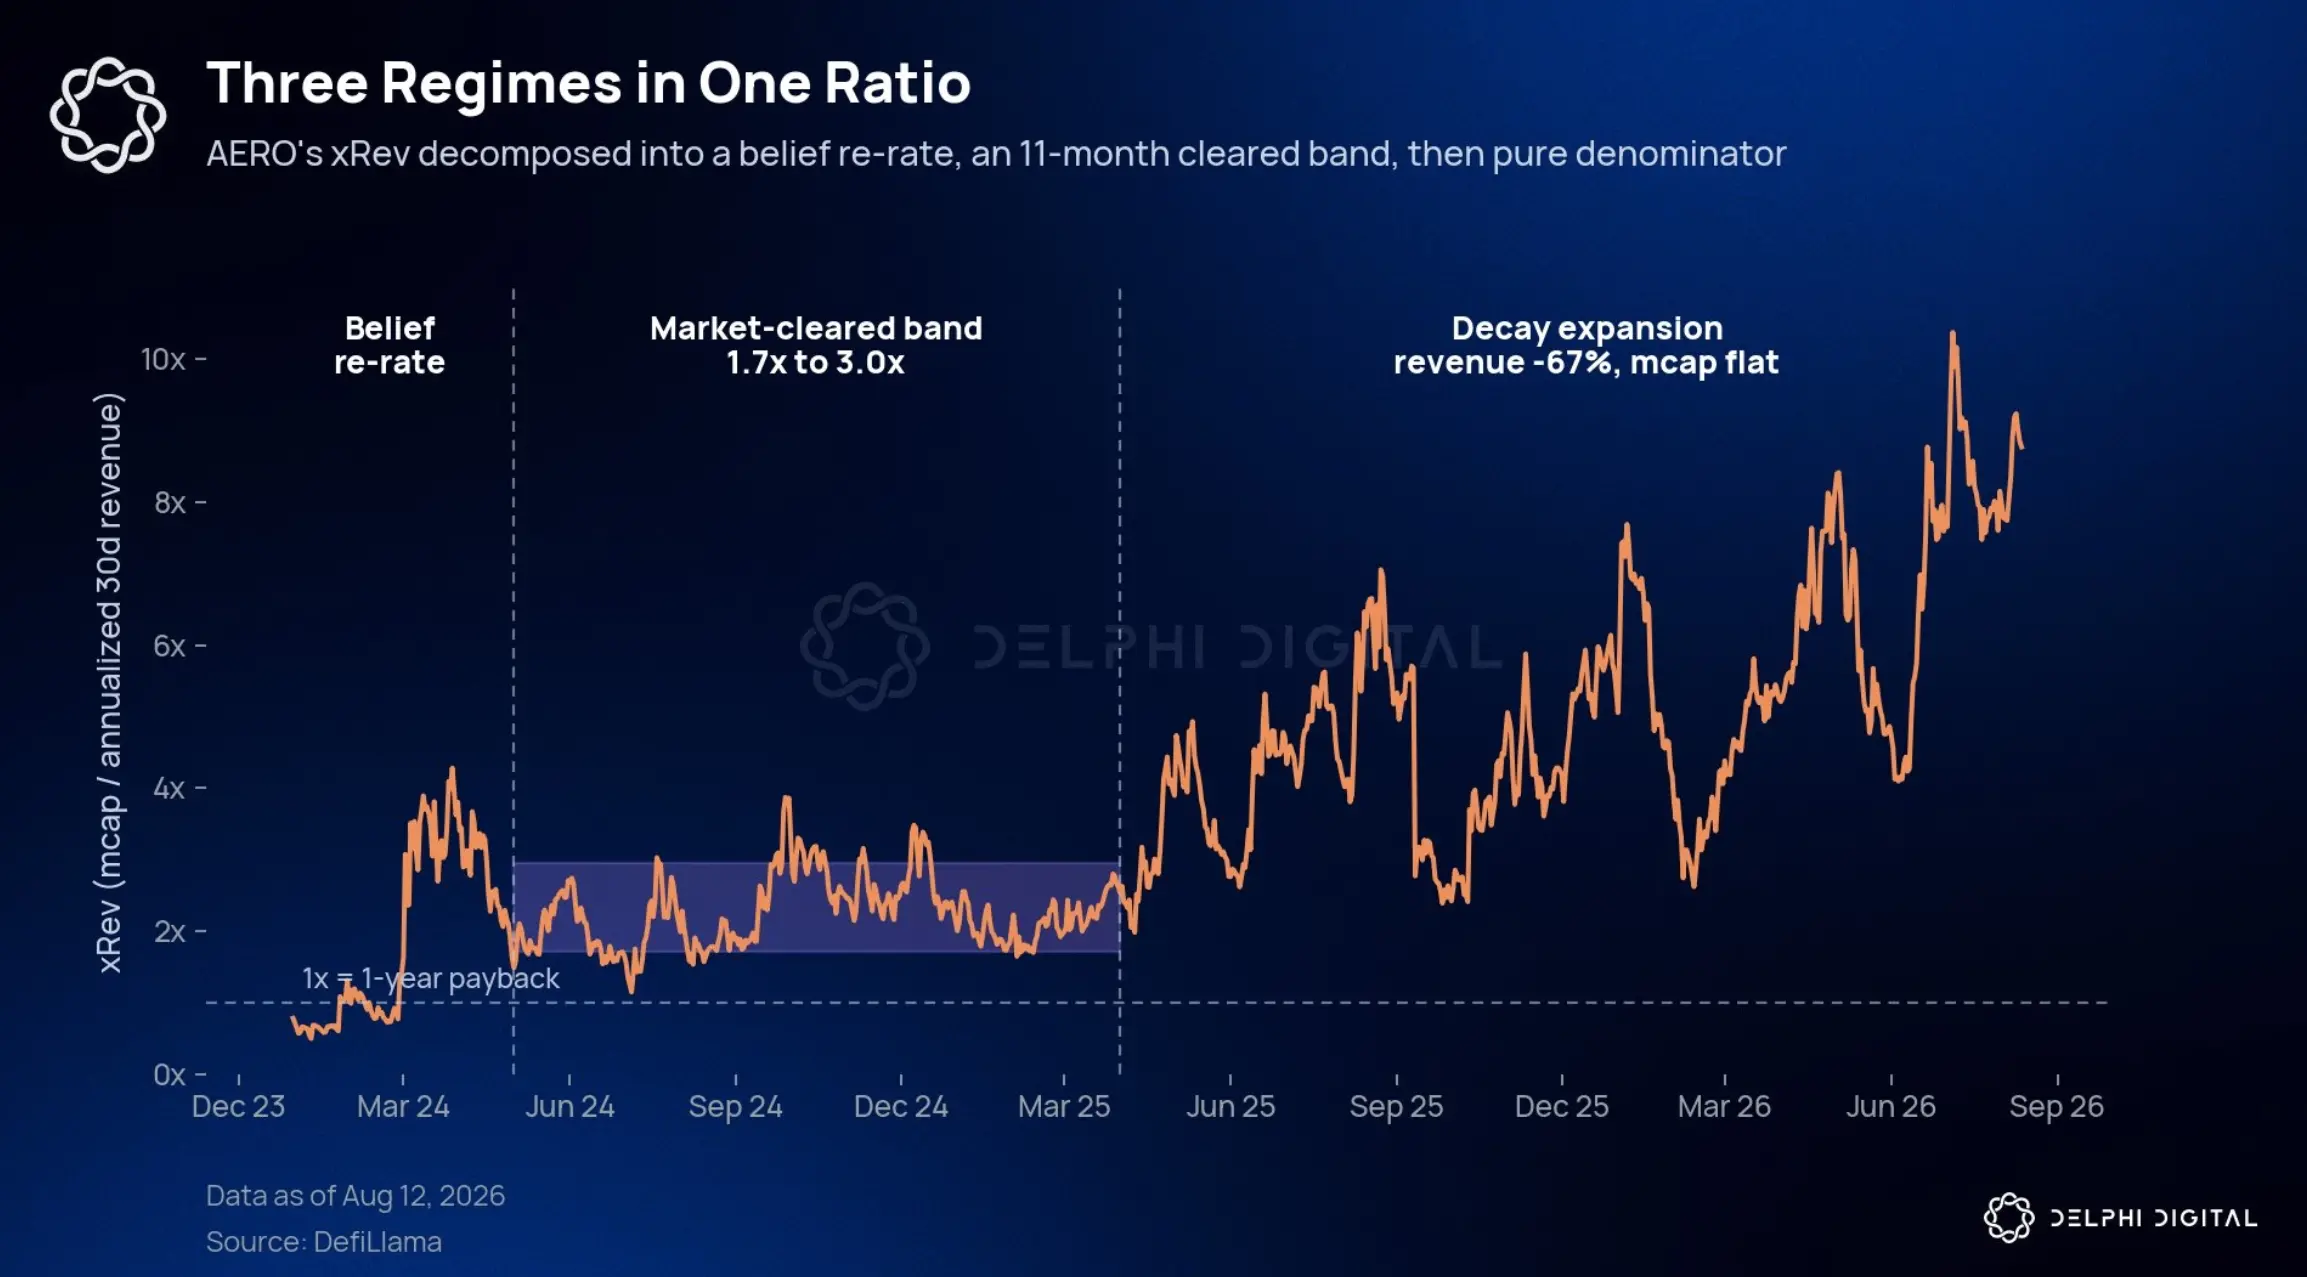
Figure 5: AERO's xRev history and its three phases.
The first phase occurred in early 2024 and is the belief revaluation phase.
The market cap grew 58 times, and revenue grew 26 times. Both legs were experiencing explosive growth, but the price ran faster because the market began to believe the story.
The second phase is the reasonable valuation range, which is also the part of the entire chart that is most easily undervalued.
From May 2024 to March 2025, for 11 consecutive months, xRev remained between 1.7 times and 3.0 times, with a median of 2.2 times. During the same period, the market cap fluctuated between $223 million and $1.57 billion, while annualized revenue changed from $141 million to $491 million.
In other words, the two data points experienced huge fluctuations of 4 times to 7 times, but xRev hardly changed. This means the market had formed its own pricing consensus: a dominant Base DEX's revenue is worth about 2 to 3 years.
The third phase broke this range.
Since April 2025, AERO's market cap has hardly changed, from $350 million to $404 million, but annualized revenue has declined by 67%. Thus, xRev has nearly doubled, while the price side contributed almost nothing. If we perform the same phase analysis on PUMP, we will see a completely different structure.
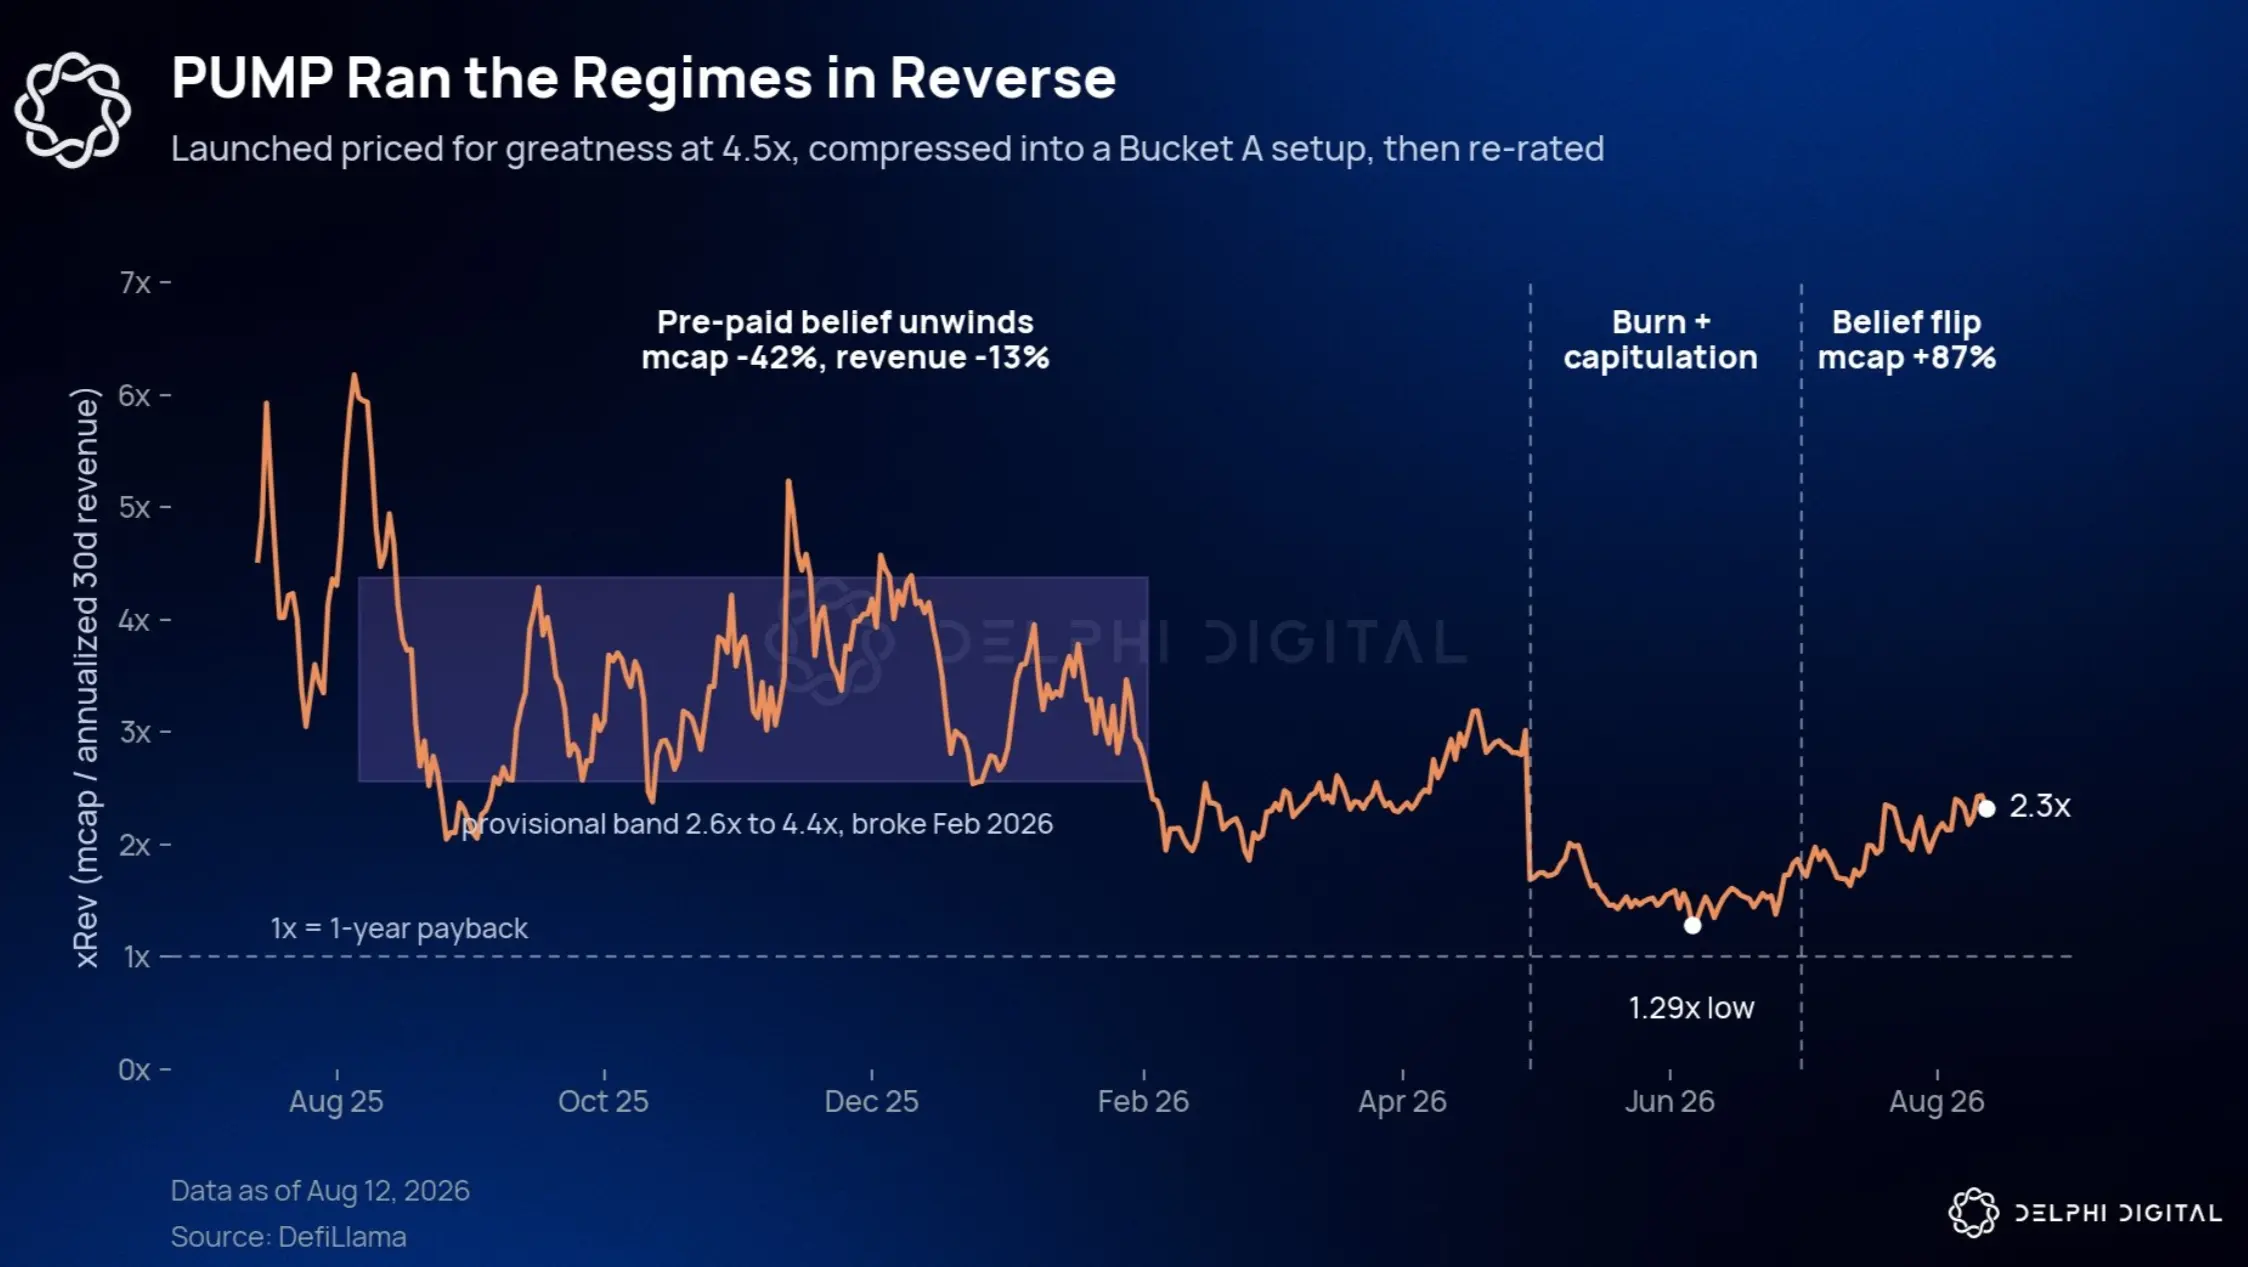
Figure 6: PUMP's xRev history and its different phases.
PUMP's chart is almost a mirror image of AERO's, but there is one very key difference.
It started from a typical Category B project position, with an opening xRev of 4.5 times because market confidence had already been priced in.
Therefore, the first phase is actually the continuous pullback of this pre-paid confidence.
During this period, the market cap declined by 42%, while revenue only declined by 13%. But PUMP's business itself did not experience any structural issues. The market was merely pulling back the premium it had previously paid.
The shaded area in the chart represents the subsequent phase of about six months, during which xRev fluctuated between 2.6 times and 4.4 times. It seemed that the market had found a stable level, but in reality, it had not.
By February, this range was broken again, entirely due to price-side sell-offs, while at the same time, the protocol's revenue set a record for the best quarterly performance. Subsequently, the restructuring in April mechanically reset the numerator. Pump burned all previously repurchased tokens, with a total value of about $370 million, accounting for 36% of the circulating supply.
Since market cap is "price × circulating supply," directly deleting one-third of the circulating supply without anyone selling a single token would reduce the circulating market cap by one-third overnight. Thus, xRev immediately dropped from about 3 times to about 1.7 times.
This part of the change does not contain any information about market belief. The next two months then entered a surrender zone. Both market cap and revenue legs changed slowly, and eventually, xRev touched a low of 1.29 times.
This low point is the moment when a Category B token completely transforms into a Category A structure. High-level and already validated revenue, compressed market cap, and the market's strongest skepticism.
The third phase then shows what happens after this skepticism is broken. The market cap rises by 87%, and revenue rises by 43%.
This is precisely the same quadrant that AERO was in at the beginning of 2024.
Is Revenue Sustaining or Declining?
To more clearly judge whether the revenue behind a multiple is sustaining or declining, we can calculate xRev using two different revenue data points. The past 12 months xRev uses market cap divided by the cumulative revenue over the past 12 months.
Thus, it actually integrates all months of the protocol's income over the past year, whether high-revenue months or low-revenue months will be counted. The instant running xRev uses the same market cap, divided by the annualized result of the most recent 30 days of revenue.
It answers another question: how many years would it take to generate revenue equivalent to the current market cap at the protocol's real earning speed today?
Both use exactly the same numerator. Therefore, any difference between these two numbers can only come from one place: the revenue trend.
If revenue has remained stable, then the earning speed over the past 30 days should be similar to the average speed over the past year, so the two multiples would also be roughly the same. If revenue is declining, then the cumulative data over the past 12 months includes those high-revenue months that no longer exist, making the past 12 months xRev appear exceptionally cheap.
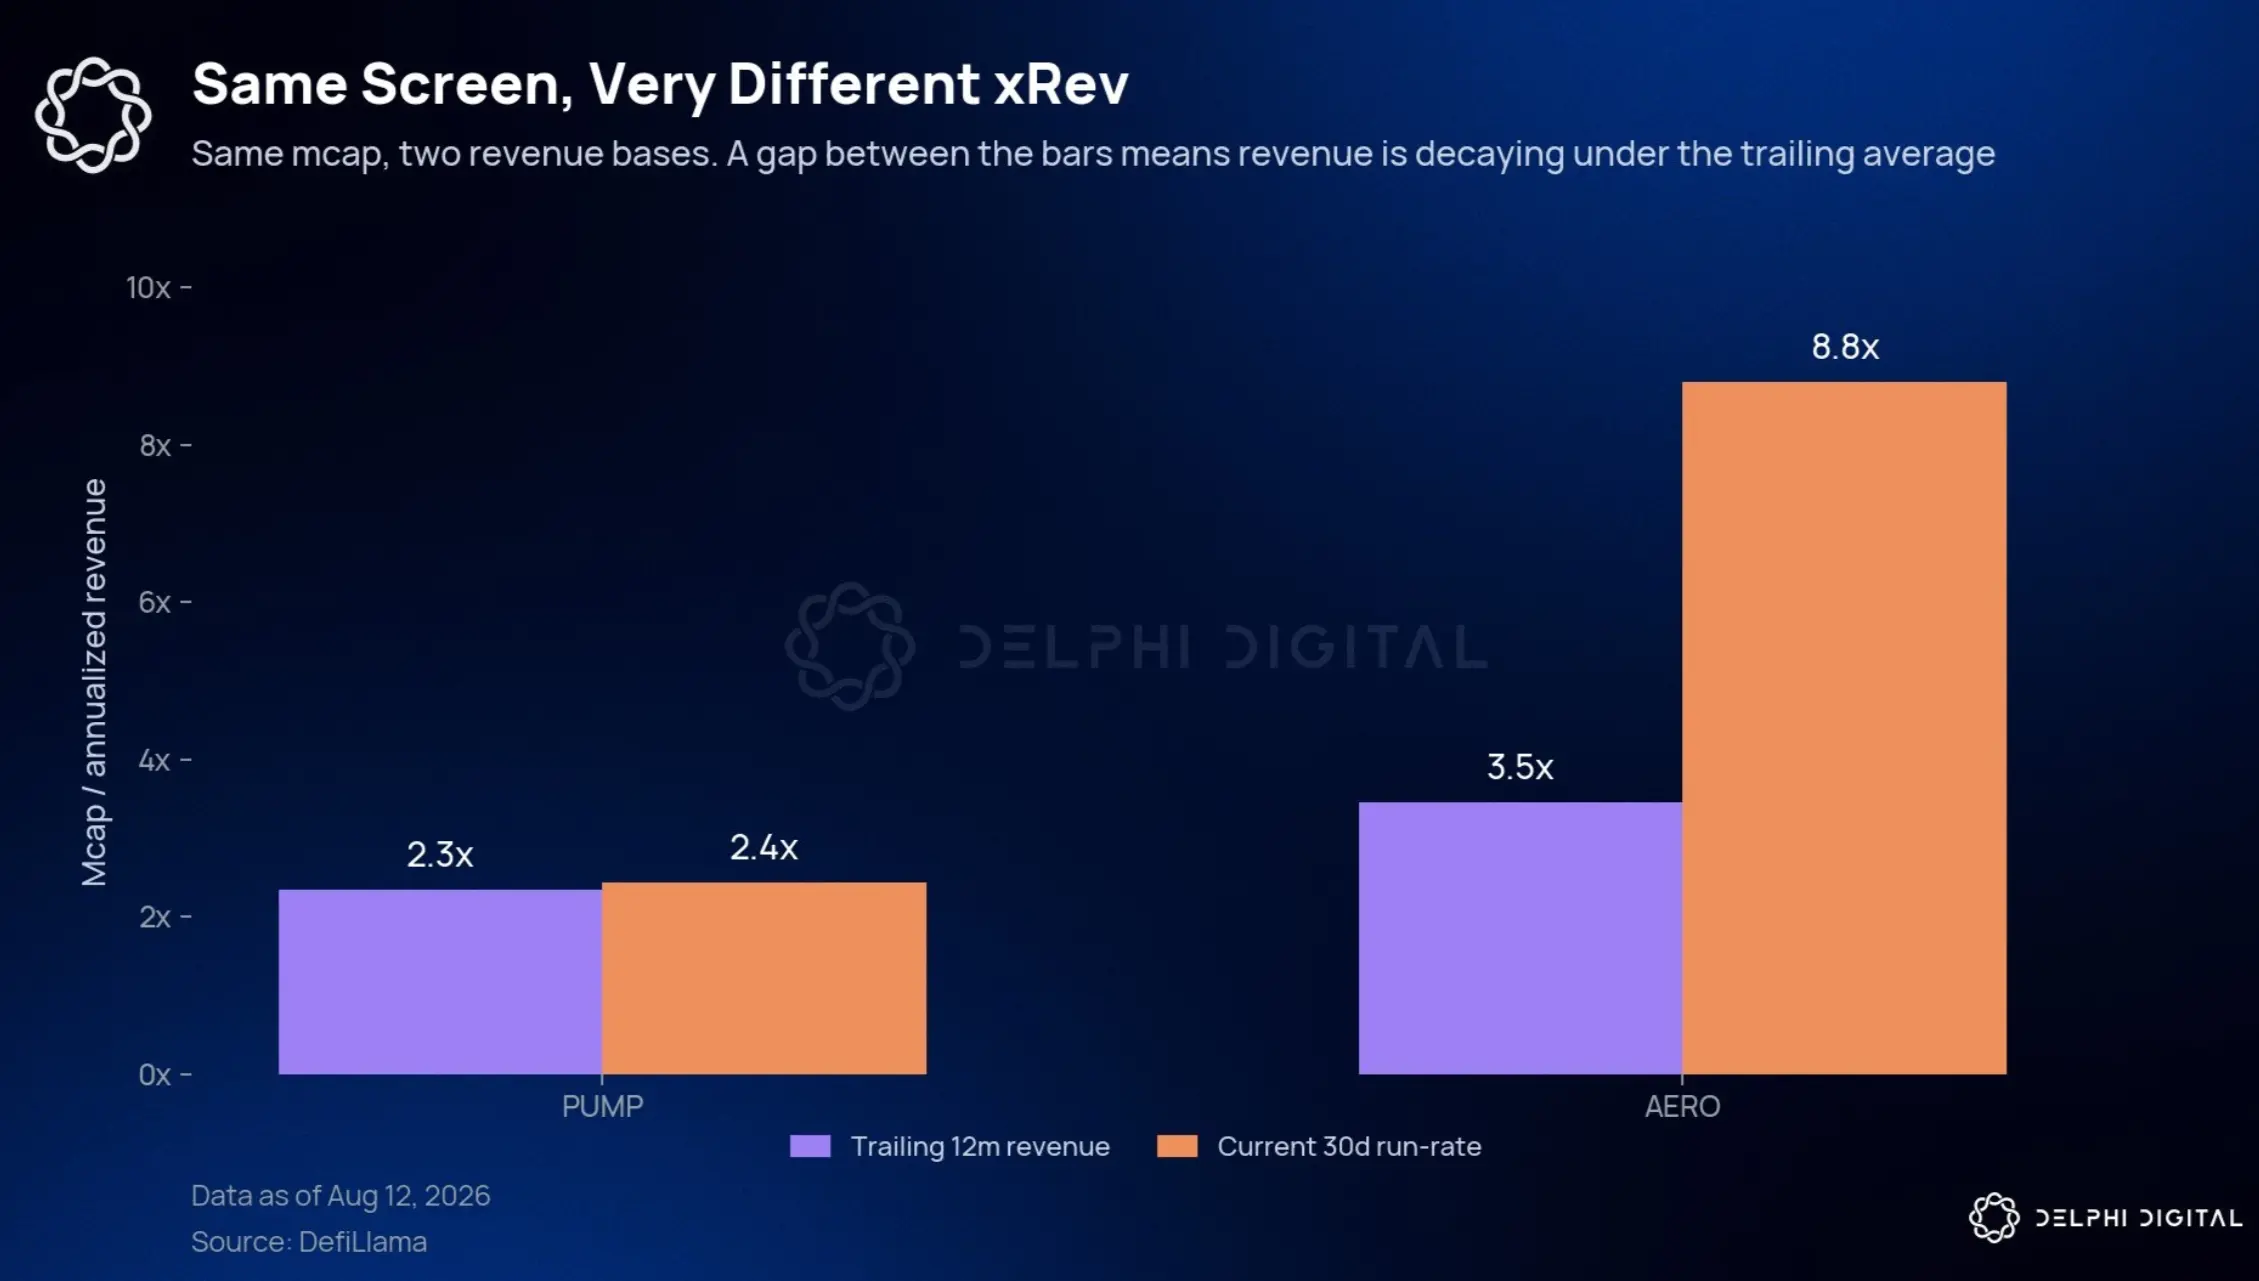
Figure 7: Past 12 months xRev vs. current running speed xRev.
AERO is a typical case of this trap. Calculated over the past 12 months, its xRev is only 3.5 times, meaning that about 3.5 years of revenue is equivalent to the current market cap.
But the premise of this conclusion is that it can still maintain the average earning speed of the past year in the future. The problem is that the past year includes some revenue that is now two to three times the quarterly amount. Calculated at today's real revenue speed, the time required is actually 8.8 years.
You can think of it as a restaurant. This restaurant made $1.2 million in sales last year, but now it can only make $30,000 a month. Someone tells you with last year's number: "This restaurant only sells at 1 times sales." But according to its current real operating level, you are actually paying 3.3 times its current annual sales.
The gap of about 2.5 times between AERO's two xRev is essentially the same thing.
PUMP is completely different.
Whether calculated based on the past 12 months or the current running speed, its xRev is about 2.3 times. The current revenue speed is basically consistent with the average level of the past year. In other words, its revenue base has not been damaged. Therefore, regardless of how xRev changes next, the main change will be on the price side, which is the market belief.
Conclusion
PUMP initially belonged to Category B. It took a year to digest the high premium at the time of token issuance, and now it has just moved from the phase where the market was most skeptical of it into a phase where it can gain returns through valuation revaluation, while its revenue base has remained largely unchanged.
AERO initially belonged to Category A. It had already undergone a valuation revaluation in 2024, but since then its multiple has been rising in the wrong way because the speed of revenue decline has been faster than the price.
What is truly worth seeking are those tokens that are currently in Category A structure. Verified high revenue, compressed market cap, and more importantly: the market has not yet believed in this story. This is the starting point that can allow valuation revaluation to account for most of the increase.
By the way, many newer revenue-generating projects are actually in Category A. They can generate six-figure revenue daily, but xRev is still pressed below 1 times.
The market currently believes that this revenue is all just a temporary phenomenon. Just like when the market thought AERO was only 0.7 times xRev, and just like when the market thought PUMP was only 1.29 times.
 Risk warning